
Home / Research / Hyperscaler AI Capex Statistics
Market research · October 13, 2026
Hyperscaler AI Capex Statistics: 2026 Report
 By Darin ten Bruggencate, Founder, AI Industry Reviews
Microsoft, Alphabet, Amazon, Meta and Oracle have each tied their 2026 capital spending plans to demand for AI computing capacity. Capital expenditures, or capex, are the cash a company spends on long-lived assets such as land, buildings, servers and networking equipment. That spending has climbed quickly, and at Oracle it now exceeds operating cash flow.
Our analysts studied the five companies' SEC filings, quarter by quarter from early 2023 through mid-2026. We measured how fast their capex is growing and how much of their revenue and cash flow it takes up. Microsoft, Alphabet, Amazon and Meta spent $165.05 billion on property and equipment in the second quarter of 2026. That was 87.0% more than a year earlier. The five companies' 2026 forecasts add up to $825 billion.
In the following sections, we track capex by quarter and its growth, compare it with revenue and operating cash flow, add in finance leases, and lay out each company's 2026 guidance.
Hyperscaler AI Capex by Quarter, 2023 to 2026
Following capital spending quarter by quarter shows how quickly the largest cloud companies have raised what they spend on data centers, servers and networking gear since early 2023.
Capital Expenditures by Quarter: Microsoft, Alphabet, Amazon and Meta ($ millions)
| Calendar Quarter | Microsoft (Fiscal Quarter) | Alphabet | Amazon | Meta | Four-Company Total |
|---|---|---|---|---|---|
| Q1 2023 | $6,607 (FY2023 Q3) | $6,289 | $14,207 | $6,823 | $33,926 |
| Q2 2023 | $8,943 (FY2023 Q4) | $6,888 | $11,455 | $6,134 | $33,420 |
| Q3 2023 | $9,917 (FY2024 Q1) | $8,055 | $12,479 | $6,496 | $36,947 |
| Q4 2023 | $9,735 (FY2024 Q2) | $11,019 | $14,588 | $7,592 | $42,934 |
| Q1 2024 | $10,952 (FY2024 Q3) | $12,012 | $14,925 | $6,400 | $44,289 |
| Q2 2024 | $13,873 (FY2024 Q4) | $13,186 | $17,620 | $8,173 | $52,852 |
| Q3 2024 | $14,923 (FY2025 Q1) | $13,061 | $22,620 | $8,258 | $58,862 |
| Q4 2024 | $15,804 (FY2025 Q2) | $14,276 | $27,834 | $14,425 | $72,339 |
| Q1 2025 | $16,745 (FY2025 Q3) | $17,197 | $25,019 | $12,941 | $71,902 |
| Q2 2025 | $17,079 (FY2025 Q4) | $22,446 | $32,183 | $16,538 | $88,246 |
| Q3 2025 | $19,394 (FY2026 Q1) | $23,953 | $35,095 | $18,829 | $97,271 |
| Q4 2025 | $29,876 (FY2026 Q2) | $27,851 | $39,522 | $21,383 | $118,632 |
| Q1 2026 | $30,876 (FY2026 Q3) | $35,674 | $44,203 | $18,997 | $129,750 |
| Q2 2026 | $35,802 (FY2026 Q4) | $44,924 | $54,208 | $30,116 | $165,050 |
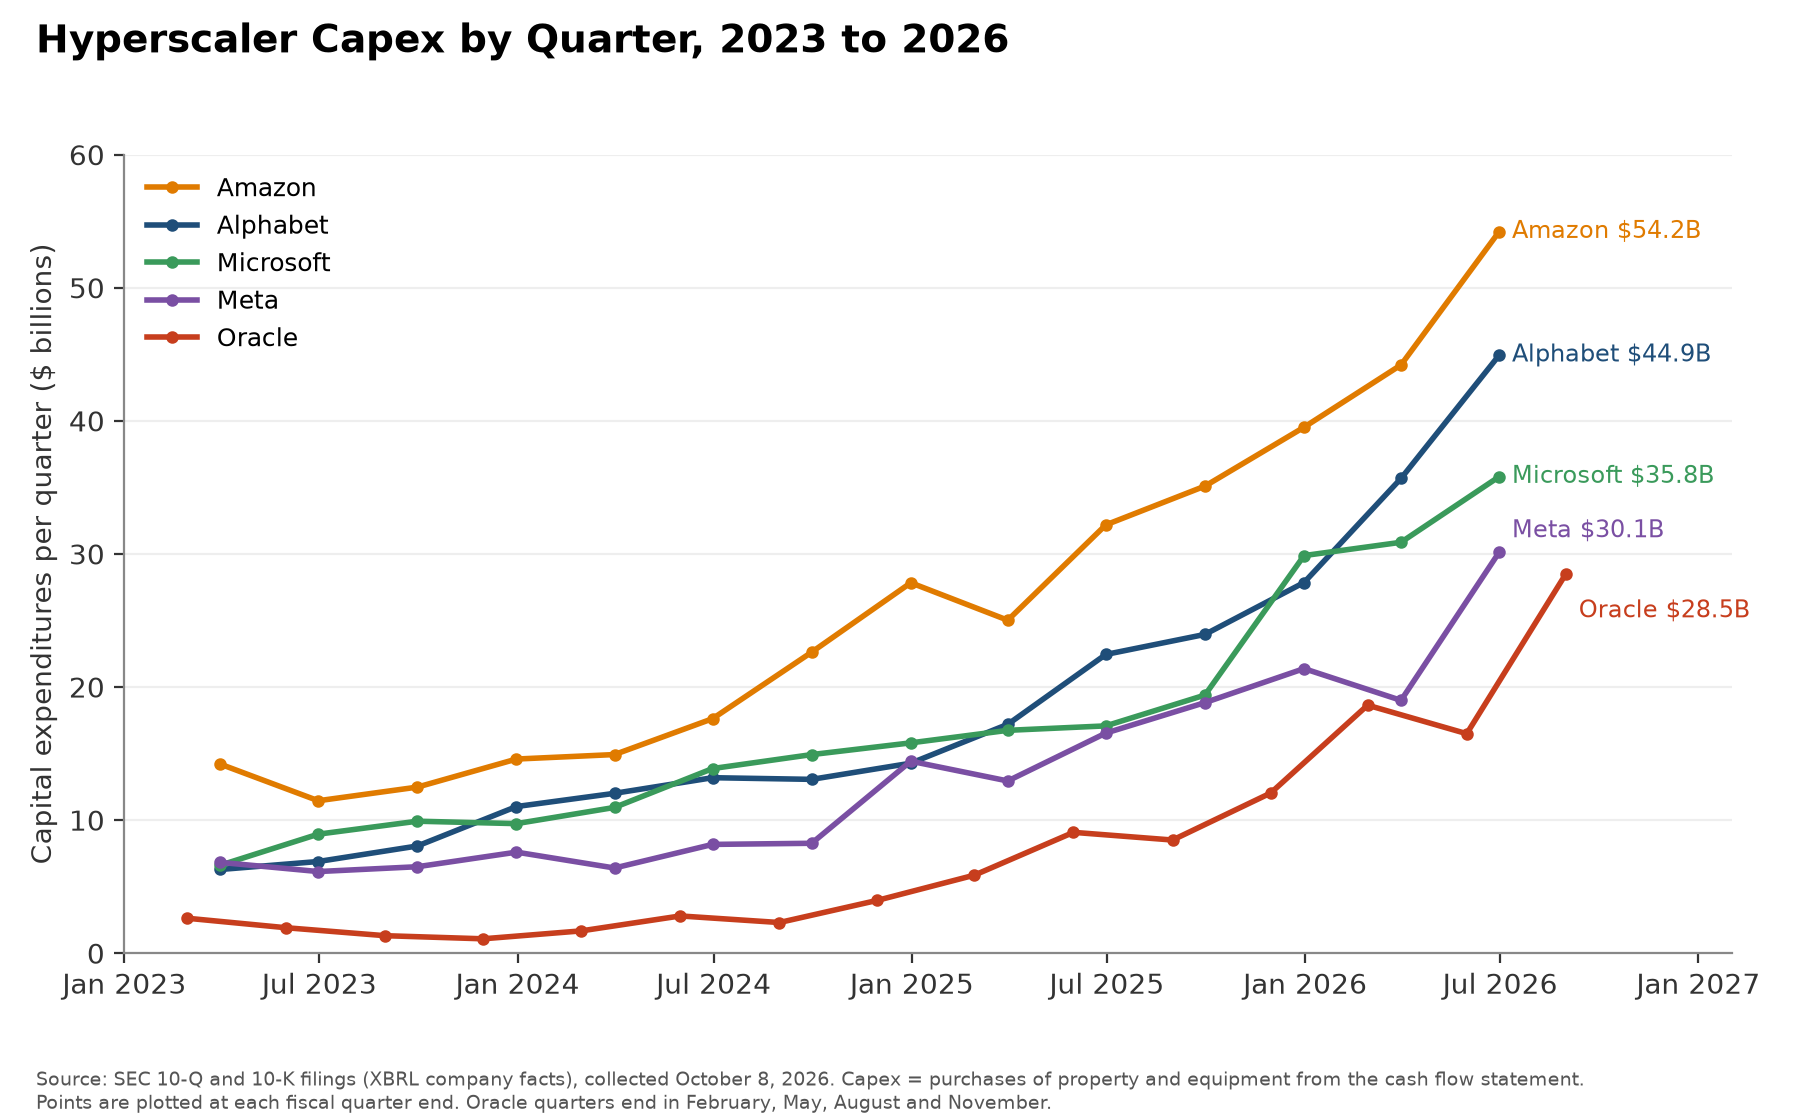
- The four companies spent $165.05 billion on property and equipment in the second quarter of 2026. That is 87.0% more than the $88.25 billion they spent a year earlier, and 4.87 times the $33.93 billion they spent in the first quarter of 2023.
- Amazon spent the most in every quarter of the period. Its second-quarter 2026 capex was $54.21 billion.
- Alphabet's quarterly capex rose from $6.29 billion in the first quarter of 2023 to $44.92 billion in the second quarter of 2026, a 7.14-fold increase and the largest of the four.
- Meta's capex fell from $21.38 billion in the fourth quarter of 2025 to $19.00 billion in the first quarter of 2026, then rose to $30.12 billion in the second quarter.
- For investors and suppliers, hyperscaler spending on AI infrastructure is still accelerating. The four companies spent $165.05 billion in Q2 2026, 87.0% more than a year earlier. Chip, server and power suppliers are likely to keep benefiting if this pace holds.
Oracle Capital Expenditures by Fiscal Quarter ($ millions)
| Oracle Fiscal Quarter | Quarter Ended | Capex | Revenue | Capex as % of Revenue | Operating Cash Flow | Capex Change vs. Year Earlier |
|---|---|---|---|---|---|---|
| Fiscal 2023 Q3 | Feb. 28, 2023 | $2,628 | $12,398 | 21.2% | $4,275 | +138.7% |
| Fiscal 2023 Q4 | May 31, 2023 | $1,913 | $13,836 | 13.8% | $5,647 | +34.4% |
| Fiscal 2024 Q1 | Aug. 31, 2023 | $1,314 | $12,453 | 10.6% | $6,974 | -23.6% |
| Fiscal 2024 Q2 | Nov. 30, 2023 | $1,080 | $12,941 | 8.3% | $143 | -55.6% |
| Fiscal 2024 Q3 | Feb. 29, 2024 | $1,674 | $13,280 | 12.6% | $5,475 | -36.3% |
| Fiscal 2024 Q4 | May 31, 2024 | $2,798 | $14,287 | 19.6% | $6,081 | +46.3% |
| Fiscal 2025 Q1 | Aug. 31, 2024 | $2,303 | $13,307 | 17.3% | $7,427 | +75.3% |
| Fiscal 2025 Q2 | Nov. 30, 2024 | $3,970 | $14,059 | 28.2% | $1,304 | +267.6% |
| Fiscal 2025 Q3 | Feb. 28, 2025 | $5,862 | $14,130 | 41.5% | $5,933 | +250.2% |
| Fiscal 2025 Q4 | May 31, 2025 | $9,080 | $15,903 | 57.1% | $6,157 | +224.5% |
| Fiscal 2026 Q1 | Aug. 31, 2025 | $8,502 | $14,926 | 57.0% | $8,140 | +269.2% |
| Fiscal 2026 Q2 | Nov. 30, 2025 | $12,033 | $16,058 | 74.9% | $2,066 | +203.1% |
| Fiscal 2026 Q3 | Feb. 28, 2026 | $18,635 | $17,190 | 108.4% | $7,151 | +217.9% |
| Fiscal 2026 Q4 | May 31, 2026 | $16,493 | $19,184 | 86.0% | $14,620 | +81.6% |
| Fiscal 2027 Q1 | Aug. 31, 2026 | $28,499 | $19,345 | 147.3% | $23,103 | +235.2% |
- Oracle spent $28.50 billion in the quarter ended August 31, 2026, more than its $19.35 billion of revenue in the same quarter. It also spent more than its quarterly revenue in the quarter ended February 28, 2026.
- Oracle's capex grew from $1.08 billion in the quarter ended November 30, 2023, to $28.50 billion in the quarter ended August 31, 2026.
- Oracle's capex topped its operating cash flow in each of the last six quarters shown. In the quarter ended November 30, 2025, it spent $12.03 billion against $2.07 billion of operating cash flow.
- Oracle is spending beyond its means to build AI capacity, which raises its financial risk. Its capex of $28.50 billion exceeded quarterly revenue, and topped operating cash flow in each of the last six quarters. If that continues, Oracle will need more debt or customer prepayments to fund its buildout.
Hyperscaler Capex Growth Year over Year
Comparing each year with the one before shows whether the spending is still speeding up or has begun to level off.
Annual Capital Expenditures, Calendar Years 2023 to 2025 ($ millions)
| Company | 2023 | 2024 | 2025 | Change, 2023 to 2024 | Change, 2024 to 2025 |
|---|---|---|---|---|---|
| Microsoft | $35,202 | $55,552 | $83,094 | +57.8% | +49.6% |
| Alphabet | $32,251 | $52,535 | $91,447 | +62.9% | +74.1% |
| Amazon | $52,729 | $82,999 | $131,819 | +57.4% | +58.8% |
| Meta | $27,045 | $37,256 | $69,691 | +37.8% | +87.1% |
| Four-company total | $147,227 | $228,342 | $376,051 | +55.1% | +64.7% |
Microsoft's columns are calendar years built from its fiscal quarters. Oracle's fiscal-year capex was $6,866 million in fiscal 2024, $21,215 million in fiscal 2025 and $55,663 million in fiscal 2026.
Latest Reported Quarter: Capex Growth and Intensity ($ millions)
| Company | Latest Quarter | Capex | Same Quarter a Year Earlier | Year-over-Year Change | Capex as % of Revenue | Capex as % of Operating Cash Flow, Trailing Four Quarters |
|---|---|---|---|---|---|---|
| Microsoft | FY2026 Q4 (ended June 30, 2026) | $35,802 | $17,079 | +109.6% | 39.8% | 63.4% |
| Alphabet | Q2 2026 | $44,924 | $22,446 | +100.1% | 37.5% | 71.3% |
| Amazon | Q2 2026 | $54,208 | $32,183 | +68.4% | 27.0% | 107.2% |
| Meta | Q2 2026 | $30,116 | $16,538 | +82.1% | 49.5% | 68.6% |
| Oracle | FY2027 Q1 (ended Aug. 31, 2026) | $28,499 | $8,502 | +235.2% | 147.3% | 161.2% |
- The four calendar-aligned companies spent $376.05 billion in 2025, up 64.7% from $228.34 billion in 2024. Spending in 2024 was up 55.1% from 2023.
- Meta had the fastest growth from 2024 to 2025, at 87.1%. It had the slowest growth from 2023 to 2024, at 37.8%.
- In the first half of 2026 the four companies spent $294.80 billion, 84.1% more than the $160.15 billion they spent in the first half of 2025. Alphabet's first-half spending more than doubled, rising 103.3% to $80.60 billion.
- Growth in AI capex is speeding up rather than leveling off. First-half 2026 spending of $294.80 billion was 84.1% above a year earlier, faster than 2025's 64.7% growth. If that pace holds, 2026 spending will far exceed 2025's $376.05 billion.
Capex as a Share of Revenue and Operating Cash Flow
Spending is easier to judge next to what each company earns, so the AI Industry Reviews research team measured capex against revenue and against the cash each business generates from its operations.
Capex Intensity, First Quarter of 2023 vs. Latest Quarter
| Company | Capex as % of Revenue, First Quarter in Period | Capex as % of Revenue, Latest Quarter | Capex as % of Operating Cash Flow, Trailing Four Quarters, First Quarter in Period | Same Measure, Latest Quarter | Trailing Four-Quarter Capex ($ millions) | Trailing Four-Quarter Operating Cash Flow ($ millions) |
|---|---|---|---|---|---|---|
| Microsoft | 12.5% | 39.8% | 31.2% | 63.4% | $115,948 | $182,935 |
| Alphabet | 9.0% | 37.5% | 31.1% | 71.3% | $132,402 | $185,675 |
| Amazon | 11.2% | 27.0% | 115.8% | 107.2% | $173,028 | $161,403 |
| Meta | 23.8% | 49.5% | 64.6% | 68.6% | $89,325 | $130,301 |
| Oracle | 21.2% | 147.3% | 52.9% | 161.2% | $75,660 | $46,940 |
The first quarter in the period is the quarter ended March 31, 2023, for the four calendar-aligned companies and February 28, 2023, for Oracle.
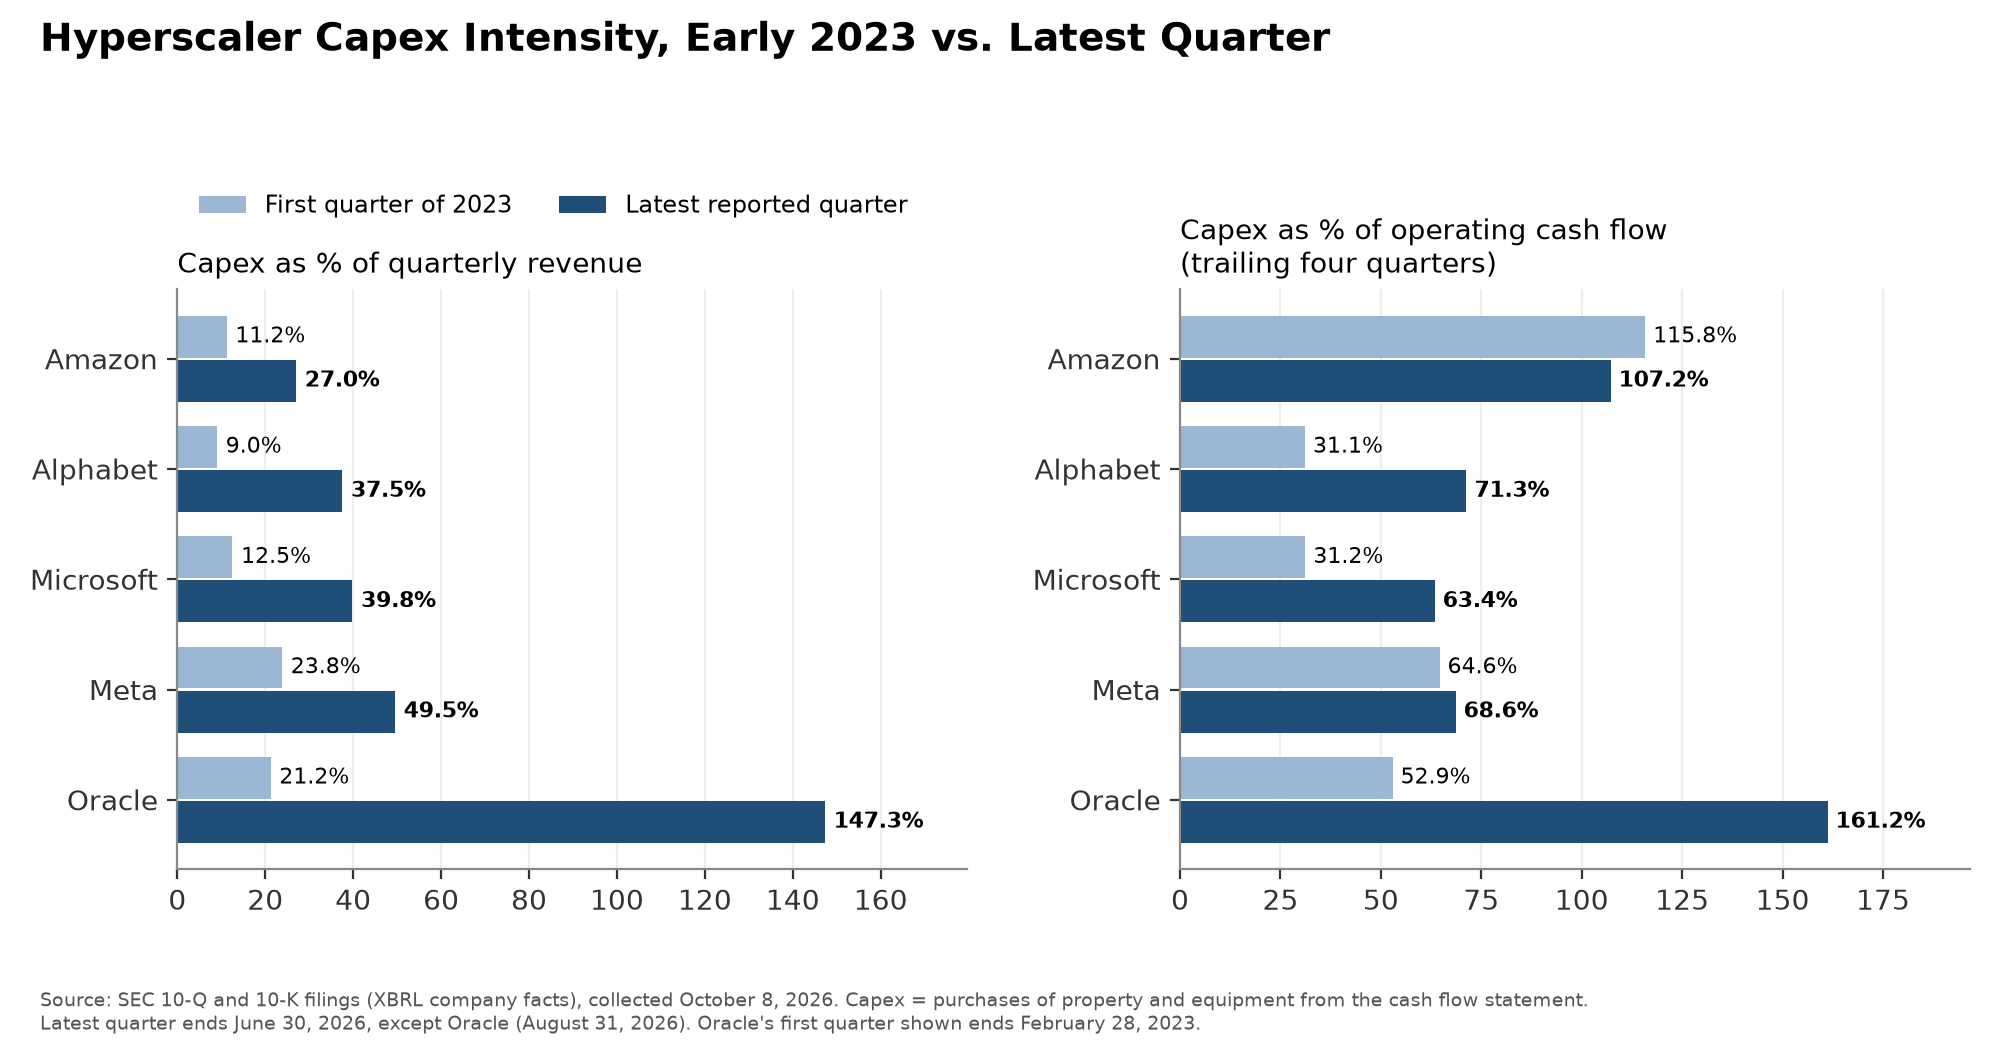
- Across Microsoft, Alphabet, Amazon and Meta, capex took 23.1% of combined revenue in 2025, up from 11.8% in 2023. In the first half of 2026 it took 32.7%.
- The same four companies spent 40.8% of their combined operating cash flow on capex in 2023 and 64.8% in 2025. In the first half of 2026 the share was 91.4%.
- Alphabet spent $44.92 billion in the second quarter of 2026 against $39.07 billion of operating cash flow. The company reported negative free cash flow of $5.86 billion for the quarter. In June 2026 Alphabet raised $49.6 billion in net proceeds from a sale of Class A and Class C stock and mandatory convertible preferred stock, which its earnings release said would go to general corporate purposes, including capital expenditures for AI infrastructure.
- Amazon's trailing four-quarter capex of $173.03 billion was larger than its trailing four-quarter operating cash flow of $161.40 billion. Amazon's ratio was also above 100% in the first quarter of 2023, when its trailing four-quarter operating cash flow was $54.33 billion. It fell to 53.9% in the first quarter of 2024 before rising again.
- Meta reported free cash flow of $784 million in the second quarter of 2026, after $30.12 billion of capex against $31.86 billion of operating cash flow.
- Capex is consuming almost all the cash these companies generate. Spending took 91.4% of operating cash flow in the first half of 2026, up from 40.8% in 2023, and Alphabet posted negative free cash flow. Shareholders are likely to see less cash for buybacks and dividends, and more bond issuance.
Hyperscaler Capex Including Finance Leases
Readers who compare these tables with the capex numbers in earnings releases will find some of those numbers larger, and leased data centers and equipment explain the gap.
Some of the five companies also count data centers and equipment acquired through finance leases, which are long-term leases recorded like purchases, in the capex figure they give investors. Each company uses its own definition.
Company-Defined Capex, Latest Quarter
| Company | Quarter | Company's Measure | Amount | Purchases of Property and Equipment ($ millions) |
|---|---|---|---|---|
| Microsoft | FY2026 Q4 | Capital expenditures including finance leases | About $41 billion, including $5.6 billion of finance leases | $35,802 |
| Alphabet | Q2 2026 | Purchases of property and equipment | $44.9 billion | $44,924 |
| Amazon | Q2 2026 | Purchases of property and equipment, net of proceeds from sales and incentives | $53.1 billion | $54,208 |
| Meta | Q2 2026 | Capital expenditures, including principal payments on finance leases | $31.08 billion | $30,116 |
| Oracle | FY2027 Q1 | Net cash outlay for capital expenditures, after customer prepayments | $17.97 billion | $28,499 |
- Microsoft's company-defined capex was about $41 billion in its fiscal fourth quarter, about $5.2 billion more than the $35.80 billion of cash it paid for property and equipment. In its fiscal third quarter it was $31.9 billion, including $4.7 billion of finance leases.
- Meta adds principal payments on finance leases to its purchases of property and equipment. Those payments were $962 million in the second quarter of 2026.
- Each company measures capex its own way, so headline figures are not directly comparable. Microsoft's own measure ran about $5.2 billion above its cash purchases in one quarter. Investors should check definitions before comparing spending across companies.
Hyperscaler Capex Guidance for 2026
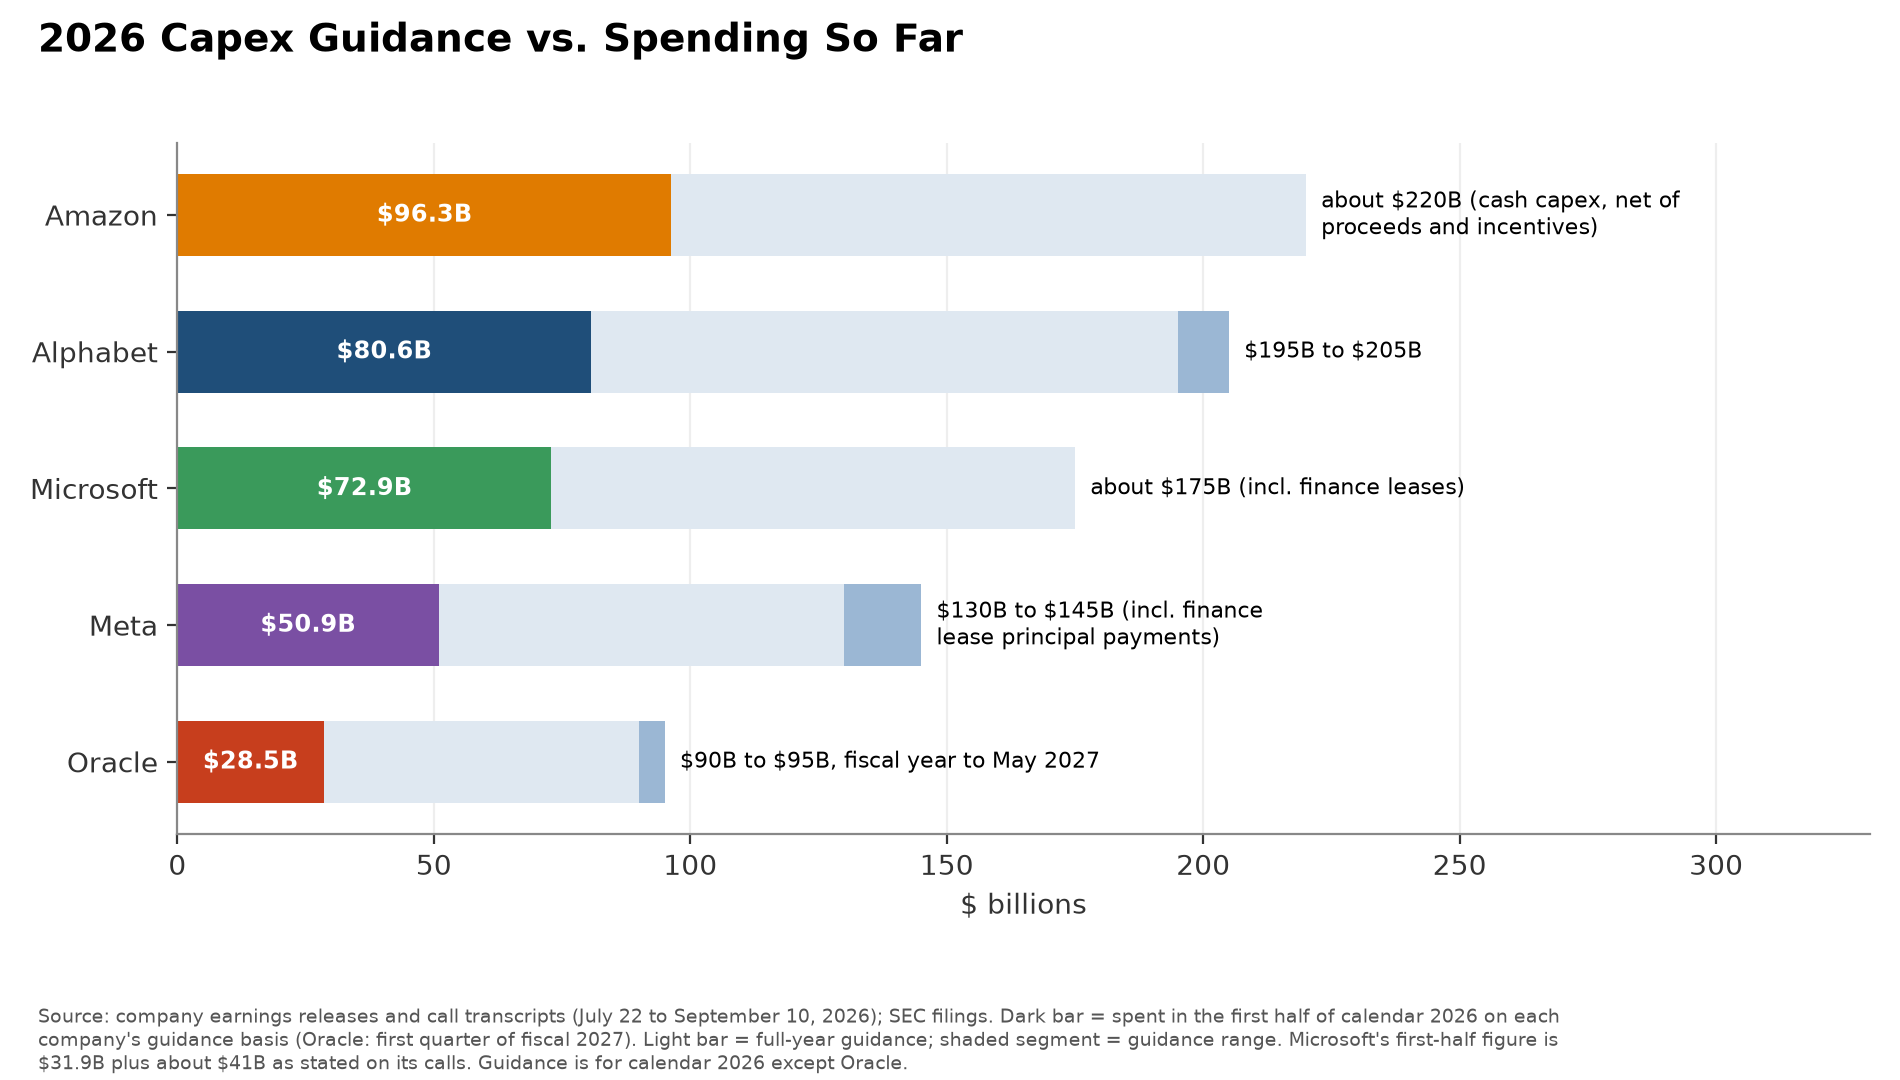
Each company has given investors a forecast for its spending in the current year, and setting those plans next to spending so far shows how much is still to come.
Latest Official Capex Guidance and Spending So Far
| Company | Period | Latest Guidance | Date Given | Prior Guidance | Prior Year on the Same Basis | Spent So Far on the Same Basis |
|---|---|---|---|---|---|---|
| Amazon | Calendar 2026 | About $220 billion in cash capex | July 30, 2026 | About $200 billion (Feb. 5, 2026) | $128.32 billion (2025) | $96.31 billion (first half of 2026) |
| Alphabet | Calendar 2026 | $195 billion to $205 billion | July 22, 2026 | $180 billion to $190 billion, raised from $175 billion to $185 billion given Feb. 4, 2026 | $91.45 billion (2025) | $80.60 billion (first half of 2026) |
| Microsoft | Calendar 2026 | About $175 billion, including finance leases | July 29, 2026 | Roughly $190 billion (Apr. 29, 2026) | Not reported on this basis | $31.9 billion and about $41 billion in the first two quarters of 2026 |
| Meta | Calendar 2026 | $130 billion to $145 billion, including principal payments on finance leases | July 29, 2026 | $125 billion to $145 billion (Apr. 29, 2026); $115 billion to $135 billion (Jan. 28, 2026) | $72.22 billion (2025) | $50.92 billion (first half of 2026) |
| Oracle | Fiscal 2027 (June 2026 to May 2027) | $90 billion to $95 billion, with not more than $70 billion in net cash capex | Reaffirmed Sept. 10, 2026 | n/a | $55.66 billion (fiscal 2026) | $28.50 billion (first quarter of fiscal 2027) |
- Amazon raised its 2026 forecast to about $220 billion on July 30. Chief executive Andy Jassy said on the call that "the higher cost of memory" pushed the number up from about $200 billion, and that "even at that amount, we will still not have enough capacity to meet all the demand we have in 2026."
- Alphabet has raised its 2026 range twice. The range started at $175 billion to $185 billion in February, moved to $180 billion to $190 billion, and reached $195 billion to $205 billion on July 22. Chief financial officer Anat Ashkenazi said the latest increase was "primarily due to an acceleration in the delivery of capacity to meet growing demand" and that Alphabet expects capex "to increase significantly in 2027."
- Microsoft lowered its calendar 2026 figure from roughly $190 billion to about $175 billion on July 29 after extending the estimated useful lives of its data centers and office buildings from 15 to 25 years. Chief financial officer Amy Hood said that change will move more future data center leases from finance leases, which Microsoft counts as capex, to operating leases, which it does not, and that "outside of this useful life impact, our calendar year 2026 CapEx investment expectations remain unchanged." She also said Microsoft expects capex for fiscal 2027 to grow year over year and to be more than $50 billion in its first fiscal quarter, which ends September 30, 2026.
- Meta has raised or narrowed its 2026 range twice. In January it tied the year-over-year growth to "increased investment to support our Meta Superintelligence Labs efforts and core business."
- The companies' own guidance points to even higher spending ahead. Their 2026 guidance adds up to about $825 billion, and Amazon and Alphabet have raised their forecasts during the year. If demand holds, 2027 spending is likely to rise again, with memory costs adding pressure.
What Hyperscaler AI Capex Trends Mean for 2027 and Beyond
The largest tech companies are spending almost all the cash their businesses bring in on AI data centers, and some have spent more than they earned. That spending keeps chip, server and power suppliers busy, but it leaves less money for shareholders and pushes the companies to borrow.
The bet only pays off if AI revenue grows fast enough to cover it. If it does, these companies will own much of the world's AI capacity. If it does not, the firms already spending beyond their cash flow will feel the pressure first, and their suppliers will see orders slow.
So if you own shares in big tech or its suppliers, follow each company's AI revenue alongside its spending, because the gap between the two is the main risk.
Data Collection and Methodology
Every figure comes from the five companies' SEC filings, earnings releases and earnings call transcripts, and the filings leave some spending in and some out.
Capex here is purchases of property and equipment from each company's cash flow statement, as reported in its 10-Q and 10-K filings with the SEC. Amazon calls the line "purchases of property and equipment," Oracle calls it "capital expenditures," and Microsoft calls it "additions to property and equipment." Revenue and net cash from operating activities come from the same filings. Cash flow statements in quarterly reports show year-to-date totals, so where a company did not report a three-month figure we subtracted the earlier year-to-date total from the later one. All figures were collected on October 8, 2026. The latest filed quarter ends June 30, 2026, for Microsoft, Alphabet, Amazon and Meta, and August 31, 2026, for Oracle.
The five companies use different fiscal years. Microsoft's fiscal year ends June 30, so the quarter ended June 30, 2026, is the fourth quarter of its fiscal 2026. Oracle's fiscal year ends May 31, so its quarters end in August, November, February and May, and the quarter ended August 31, 2026, is the first quarter of its fiscal 2027. Alphabet, Amazon and Meta use the calendar year. For that reason Oracle has its own table and is left out of the four-company totals. Year-over-year growth compares each quarter with the same fiscal quarter a year earlier. Capex as a share of operating cash flow uses the trailing four quarters, because single-quarter cash flow swings with tax and billing timing. Forward guidance is quoted from each company's earnings releases and earnings call transcripts.
Capex figures cover all capital spending, including warehouses, offices and non-AI cloud equipment, because none of the five companies breaks out AI capex in its filings. Purchases of property and equipment leave out assets acquired through finance leases, which Microsoft and Meta include in the capex totals they give investors, so the cash figures in our tables are lower than those company totals in some quarters. Quarterly figures for quarters that were not reported as three-month amounts are derived from year-to-date totals. Oracle's quarters end two months after the others', so its figures are not added into calendar-quarter totals.
Sources
- AI Industry Reviews, Hyperscaler AI Capex Study: analysis of quarterly capital expenditures, revenue and operating cash flow reported by Microsoft, Alphabet, Amazon, Meta and Oracle in SEC filings for quarters from early 2023 through the quarters ended June 30 and August 31, 2026, with capex guidance from earnings releases and call transcripts, conducted October 2026.
- SEC EDGAR XBRL company facts API (data.sec.gov), Microsoft, Alphabet, Amazon, Meta and Oracle. https://www.sec.gov/search-filings/edgar-application-programming-interfaces
- Microsoft, Form 10-K for fiscal year ended June 30, 2026. https://www.sec.gov/Archives/edgar/data/789019/000119312526323660/0001193125-26-323660-index.htm
- Alphabet, Form 10-Q for quarter ended June 30, 2026. https://www.sec.gov/Archives/edgar/data/1652044/000165204426000071/0001652044-26-000071-index.htm
- Amazon, Form 10-Q for quarter ended June 30, 2026. https://www.sec.gov/Archives/edgar/data/1018724/000101872426000026/0001018724-26-000026-index.htm
- Meta, Form 10-Q for quarter ended June 30, 2026. https://www.sec.gov/Archives/edgar/data/1326801/000162828026050705/0001628280-26-050705-index.htm
- Oracle, Form 10-Q for quarter ended August 31, 2026. https://www.sec.gov/Archives/edgar/data/1341439/000119312526389274/0001193125-26-389274-index.htm
- Microsoft, FY26 fourth quarter earnings conference call transcript, July 29, 2026. https://www.microsoft.com/en-us/investor/events/fy-2026/earnings-fy-2026-q4
- Microsoft, FY26 third quarter earnings conference call transcript, April 29, 2026. https://www.microsoft.com/en-us/investor/events/fy-2026/earnings-fy-2026-q3
- Alphabet, second quarter 2026 earnings release, July 22, 2026. https://www.sec.gov/Archives/edgar/data/1652044/000165204426000066/googexhibit991q22026.htm
- Alphabet, second quarter 2026 earnings call transcript, July 22, 2026. https://s206.q4cdn.com/479360582/files/doc_events/2026/Jul/22/2026_Q2_Earnings_Transcript.pdf
- Alphabet, fourth quarter and fiscal year 2025 earnings release, February 4, 2026. https://www.sec.gov/Archives/edgar/data/1652044/000165204426000012/googexhibit991q42025.htm
- Amazon, second quarter 2026 earnings release, July 30, 2026. https://www.sec.gov/Archives/edgar/data/1018724/000101872426000024/amzn-20260630xex991.htm
- Amazon, fourth quarter 2025 earnings release, February 5, 2026. https://www.sec.gov/Archives/edgar/data/1018724/000101872426000002/amzn-20251231xex991.htm
- Amazon, second quarter 2026 earnings call transcript, July 30, 2026 (The Motley Fool). https://www.fool.com/earnings/call-transcripts/2026/08/07/amazon-amzn-q2-2026-earnings-call-transcript/
- Meta, second quarter 2026 earnings release, July 29, 2026. https://www.sec.gov/Archives/edgar/data/1326801/000162828026050596/meta-06302026xexhibit991.htm
- Meta, first quarter 2026 earnings release, April 29, 2026. https://www.sec.gov/Archives/edgar/data/1326801/000162828026028364/meta-03312026xexhibit991.htm
- Meta, fourth quarter and full year 2025 earnings release, January 28, 2026. https://www.sec.gov/Archives/edgar/data/1326801/000162828026003832/meta-12312025xexhibit991.htm
- Oracle, first quarter fiscal 2027 earnings release, September 10, 2026. https://www.sec.gov/Archives/edgar/data/1341439/000119312526387905/orcl-ex99_1.htm
- Oracle, fourth quarter fiscal 2026 earnings release, June 10, 2026. https://www.sec.gov/Archives/edgar/data/1341439/000119312526265848/orcl-ex99_1.htm
- Oracle, first quarter fiscal 2027 earnings call transcript, September 10, 2026 (The Motley Fool). https://www.fool.com/earnings/call-transcripts/2026/09/11/oracle-orcl-q1-2027-earnings-call-transcript/