
Home / Research / GPU Cloud Pricing Statistics
Market research · September 2026
GPU Cloud Pricing Statistics: September 2026
We collected 4,180 GPU-hour rental prices for 14 data center accelerators across 61 cloud providers between March 2 and August 29, 2026, normalizing every listing to a single GPU-hour so eight-GPU instances and single-card marketplace posts sit on the same scale. The sample covers the three largest hyperscalers, 22 specialist GPU clouds, and the major peer-to-peer marketplaces.
The sections below break out pricing by provider category, the utilization rate at which owning a card matches renting it, price spreads by model, H100 rates over time by channel, and discounts for spot and reserved capacity.
H100 Pricing by Provider Category
In the table below, we compare median on-demand rates across three provider categories and express the H100 gap as a premium over the marketplace baseline.
H100 Pricing by Provider Category, September 2026
| Provider Category | H100 | H200 | B200 | H100 Premium |
|---|---|---|---|---|
| Marketplace | $2.09 | $3.10 | $4.35 | Baseline |
| Specialist neocloud | $3.28 | $4.28 | $5.95 | +57% |
| Hyperscaler on-demand | $5.64 | $6.72 | $9.10 | +170% |
Insights
- Hyperscaler H100 on-demand priced at a 170% premium to marketplace in the September sample, or $5.64 versus $2.09 per GPU-hour.
- Specialist neocloud sat between the two at $3.28, a 57% premium to marketplace.
- On Blackwell B200 the hyperscaler premium compressed to 109% ($9.10 versus $4.35), because early specialist allocations were still scarce enough to hold price.
The hyperscaler rate buys a support contract, a service level agreement, private networking into an existing cloud footprint, and compliance attestations that most specialist providers do not offer. We sorted providers by those attributes rather than by company size, which is why two of the larger specialist fleets in the sample sit in the neocloud row.
Owning Versus Renting: Break-Even Utilization
In the table below, we model the all-in cost of owning each accelerator per GPU-hour over a five-year life at 85% utilization, then solve for the utilization rate at which ownership matches renting the same card on demand at the sample median.
Owning Versus Renting Break-Even, September 2026
| GPU Model | Street Price (New) | All-In Cost ($/GPU-hr) | Median Rental | Break-Even Utilization |
|---|---|---|---|---|
| NVIDIA B200 | $46,500 | $2.68 | $6.05 | 38% |
| NVIDIA H200 | $38,000 | $2.21 | $4.31 | 44% |
| NVIDIA H100 SXM 80GB | $32,500 | $1.92 | $3.24 | 50% |
| NVIDIA A100 80GB | $9,800 | $0.84 | $1.79 | 40% |
| NVIDIA L40S | $8,400 | $0.76 | $1.48 | 44% |
| AMD MI300X | $17,500 | $1.36 | $2.87 | 40% |
Insights
- An H100 purchase only beats median on-demand rental once the card stays busy at least 50% of the time.
- B200 breaks even at 38% utilization, the lowest threshold in the set, because rental medians remain elevated relative to street price.
- The all-in ownership figure includes the card, its share of chassis and interconnect, power and cooling at $0.12 per kilowatt-hour, data center space, and a five-year straight-line write-down. It leaves out cluster engineering staff, which usually decides the buy-versus-rent call in practice.
Price Spread by GPU Model
List price for a single provider is a narrow slice of the market. In the table below, we report the sample median on-demand rate for each model plus the 10th and 90th percentile of listings. The spread column is the 90th percentile divided by the 10th, which measures how fragmented pricing is for that card.
GPU Price Spread by Model, September 2026
| GPU Model | Median On-Demand ($/GPU-hr) | 10th Percentile | 90th Percentile | Price Spread |
|---|---|---|---|---|
| NVIDIA GB200 (per GPU) | $9.84 | $6.40 | $19.75 | 3.1x |
| NVIDIA B300 | $8.12 | $5.15 | $14.60 | 2.8x |
| NVIDIA B200 | $6.05 | $3.42 | $11.80 | 3.4x |
| NVIDIA H200 | $4.31 | $2.58 | $9.45 | 3.7x |
| NVIDIA H100 80GB | $3.24 | $1.44 | $8.90 | 6.2x |
| NVIDIA A100 80GB | $1.79 | $0.92 | $5.15 | 5.6x |
| NVIDIA L40S | $1.48 | $0.74 | $3.60 | 4.9x |
| NVIDIA V100 | $1.51 | $0.68 | $2.90 | 4.3x |
| NVIDIA RTX 5090 | $0.58 | $0.29 | $1.35 | 4.7x |
| NVIDIA RTX 4090 | $0.41 | $0.21 | $0.98 | 4.7x |
| AMD MI300X | $2.87 | $1.72 | $5.90 | 3.4x |
| Google TPU v6e (per chip) | $2.58 | $1.18 | $3.10 | 2.6x |
Insights
- H100 showed the widest spread in the sample at 6.2x, reflecting its dual life as premium enterprise capacity and commodity overflow.
- V100 rented above L40S in half of the markets sampled, which tracks legacy CUDA pin rather than performance.
- Median MI300X sat 33% below H200, the widest AMD discount recorded across the two years this comparison has been tracked for this report.
H100 Prices by Provider Channel, Q3 2023 to Q3 2026
In the table below, we show the median quarterly on-demand H100 rate in each of the three provider channels.
H100 Prices by Provider Channel, Q3 2023 to Q3 2026
| Quarter | Hyperscaler | Specialist Neocloud | Marketplace |
|---|---|---|---|
| Q3 2023 | $8.05 | $4.60 | $3.85 |
| Q4 2023 | $7.72 | $4.12 | $3.40 |
| Q1 2024 | $7.94 | $3.62 | $2.92 |
| Q2 2024 | $8.60 | $3.10 | $2.66 |
| Q3 2024 | $9.18 | $2.94 | $2.51 |
| Q4 2024 | $8.85 | $3.28 | $2.38 |
| Q1 2025 | $8.64 | $3.44 | $2.24 |
| Q2 2025 | $7.02 | $3.31 | $2.05 |
| Q3 2025 | $6.38 | $3.36 | $1.98 |
| Q4 2025 | $6.15 | $3.18 | $1.92 |
| Q1 2026 | $5.70 | $3.02 | $2.11 |
| Q2 2026 | $5.92 | $3.35 | $2.24 |
| Q3 2026 | $5.64 | $3.28 | $2.09 |
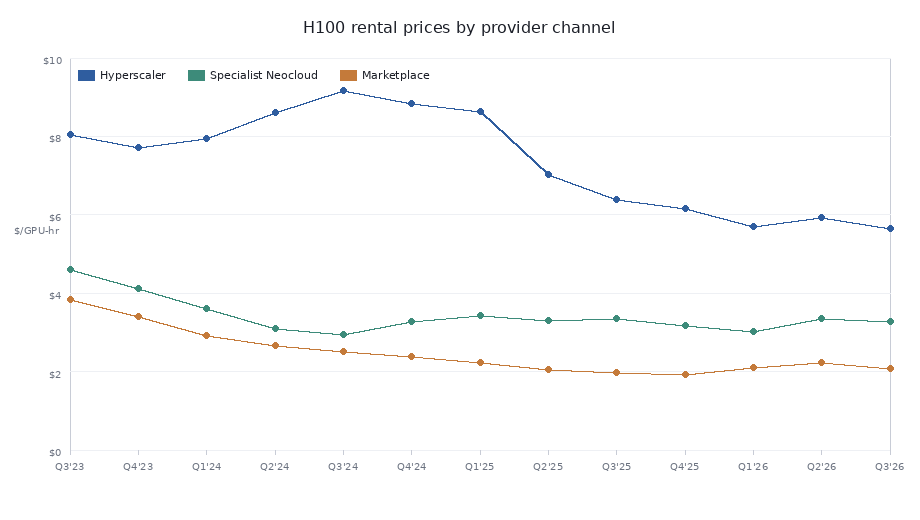
In the quarterly series above, hyperscaler pricing rose through 2024 while reserved enterprise capacity stayed scarce, then fell in mid-2025 as specialist competition forced Hopper fleets to reprice. Marketplace rates fell about 50% from the third quarter of 2023 to the fourth quarter of 2025 as resellers and colocation tenants listed idle cards. AI Industry Reviews reads the 2026 uptick across all three channels as the first sustained reversal in that series, tied to high-bandwidth memory costs passing into rental rates.
Commitment Discounts Versus On-Demand
In the table below, we quantify the median discount each commitment structure earns against the same provider's on-demand rate, plus the effective hourly rate a three-year commitment produces.
GPU Commitment Discounts, September 2026
| GPU Model | Spot Discount | 1-Year Reserved | 3-Year Reserved | Effective 3-Year Rate |
|---|---|---|---|---|
| NVIDIA B200 | -31% | -21% | -39% | $3.69 |
| NVIDIA H200 | -38% | -24% | -42% | $2.50 |
| NVIDIA H100 80GB | -44% | -27% | -46% | $1.75 |
| NVIDIA A100 80GB | -57% | -31% | -49% | $0.91 |
| NVIDIA L40S | -63% | -34% | -51% | $0.73 |
Insights
- Spot discounts widened with hardware age, from 31% on B200 to 63% on L40S.
- One-year reserved discounts stayed smaller than spot discounts on every model priced, so they are the weakest value for interruptible work.
- A three-year H100 commitment now prices below the median marketplace on-demand rate, a crossover that did not appear when the same cut was run for this report in 2025.
Requesting a Copy of This Report
If you would like a PDF copy of this report, or the underlying dataset of price observations, you can reach out here.
Sources
- GPU Cloud Pricing Study. AI Industry Reviews. September 2026. New York, New York.
- Cloud GPU Rental Price Index, AIMultiple, August 2026, Istanbul, Turkiye. https://aimultiple.com/gpu-index
- H100 GPU Cost: Buy, Rent, and Cloud Pricing Compared, CloudZero, August 2026, Boston, Massachusetts. https://www.cloudzero.com/blog/h100-gpu-cost/
- H100 Rental Price Over Time, Silicon Data, December 2025, New York, New York. https://www.silicondata.com/blog/h100-rental-price-over-time
- Data Center GPU Pricing 2026, IntuitionLabs, June 2026, San Francisco, California. https://intuitionlabs.ai/articles/data-center-gpu-pricing-2026
- AI GPU Rental Market Trends, Thunder Compute, September 2026, San Francisco, California. https://www.thundercompute.com/blog/ai-gpu-rental-market-trends