
Home / Research / FDA AI Medical Device Clearance Statistics
FDA AI Medical Device Clearance Statistics: 2026 Report
 By Darin ten Bruggencate, Founder, AI Industry Reviews · November 19, 2026
Our analysts counted all 1,614 rows on the FDA's AI-Enabled Medical Device List, downloaded as a CSV on November 13, 2026. The file was last modified on September 4, 2026, and the newest decision on the list is dated June 29, 2026. We tallied authorizations by year of final decision, by lead review panel, and by pathway, using the prefix of each submission number: K for 510(k), DEN for De Novo, and P for premarket approval. We also counted companies as they appear on the list.
Key Findings
- The FDA's AI-enabled device list holds 1,614 authorizations, with decision dates from September 29, 1995, through June 29, 2026.
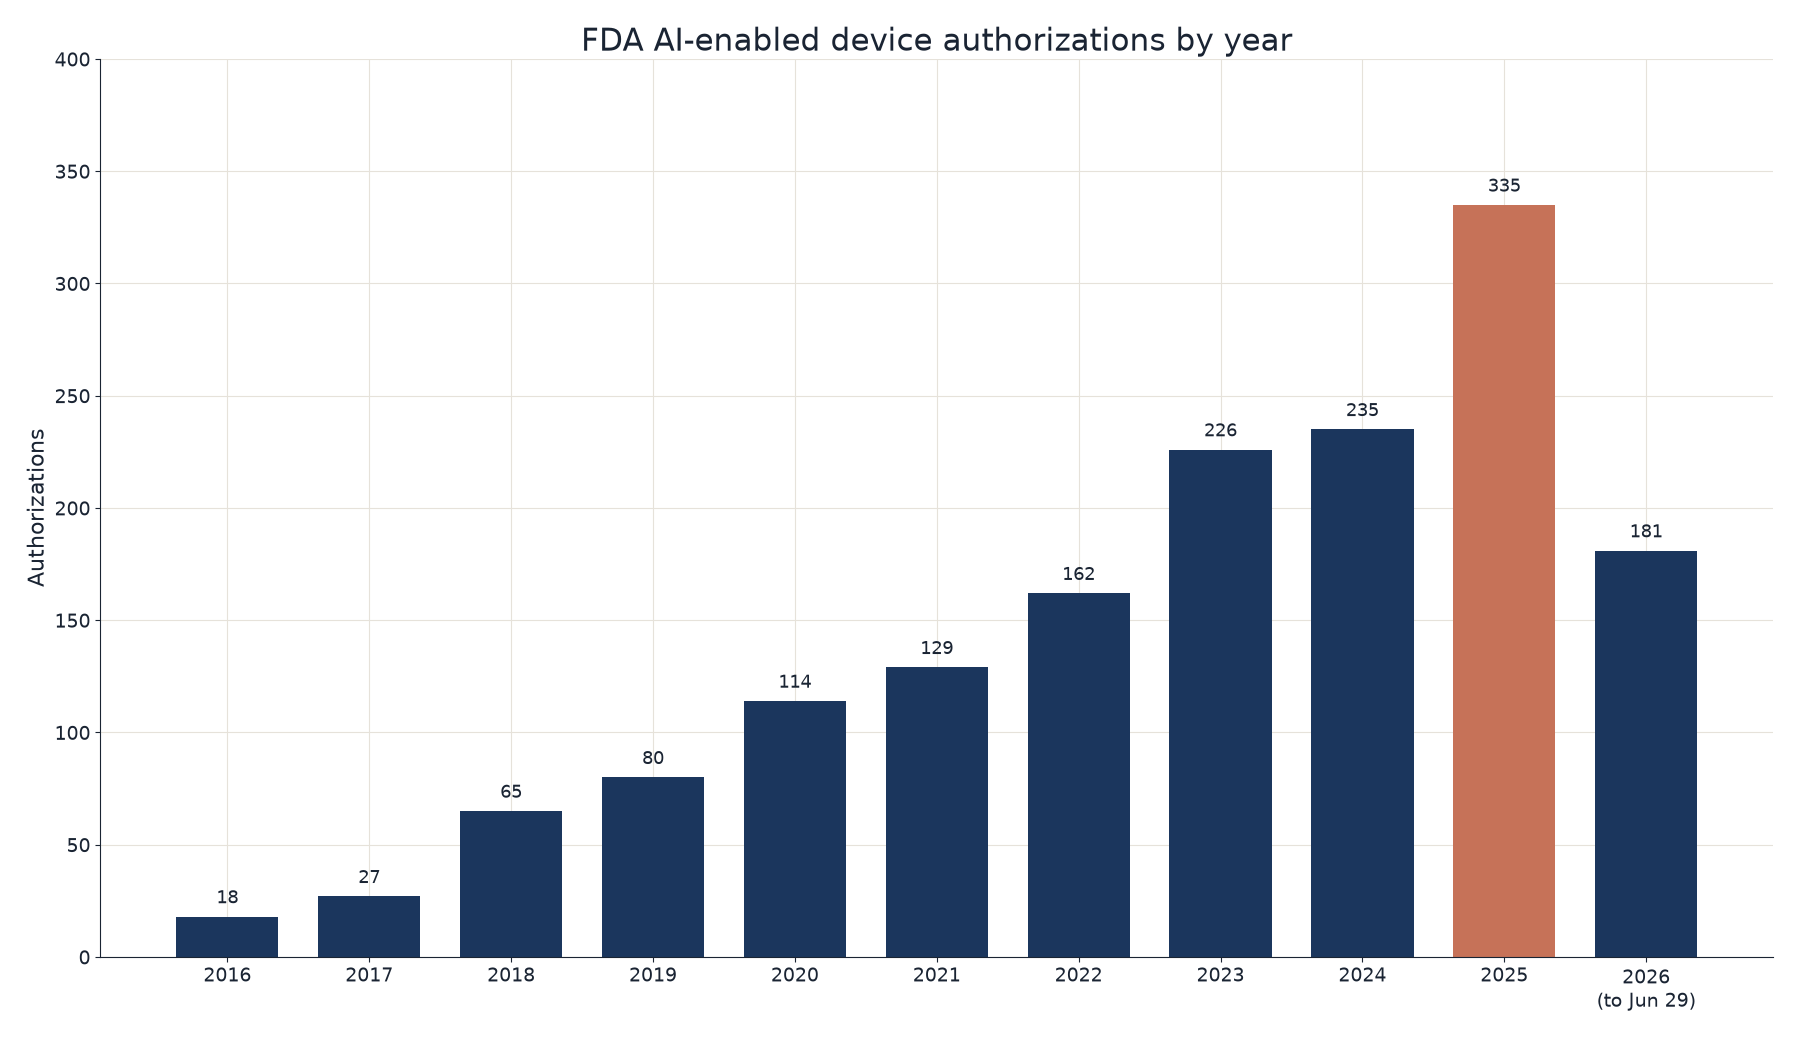
- The FDA authorized 335 AI-enabled devices in 2025, the peak year and 42.6% more than the 235 in 2024, and 181 more in 2026 through June 29.
- 510(k) clearances account for 1,553 of the 1,614 entries, or 96.2%, with 40 De Novo authorizations and 21 premarket approvals.
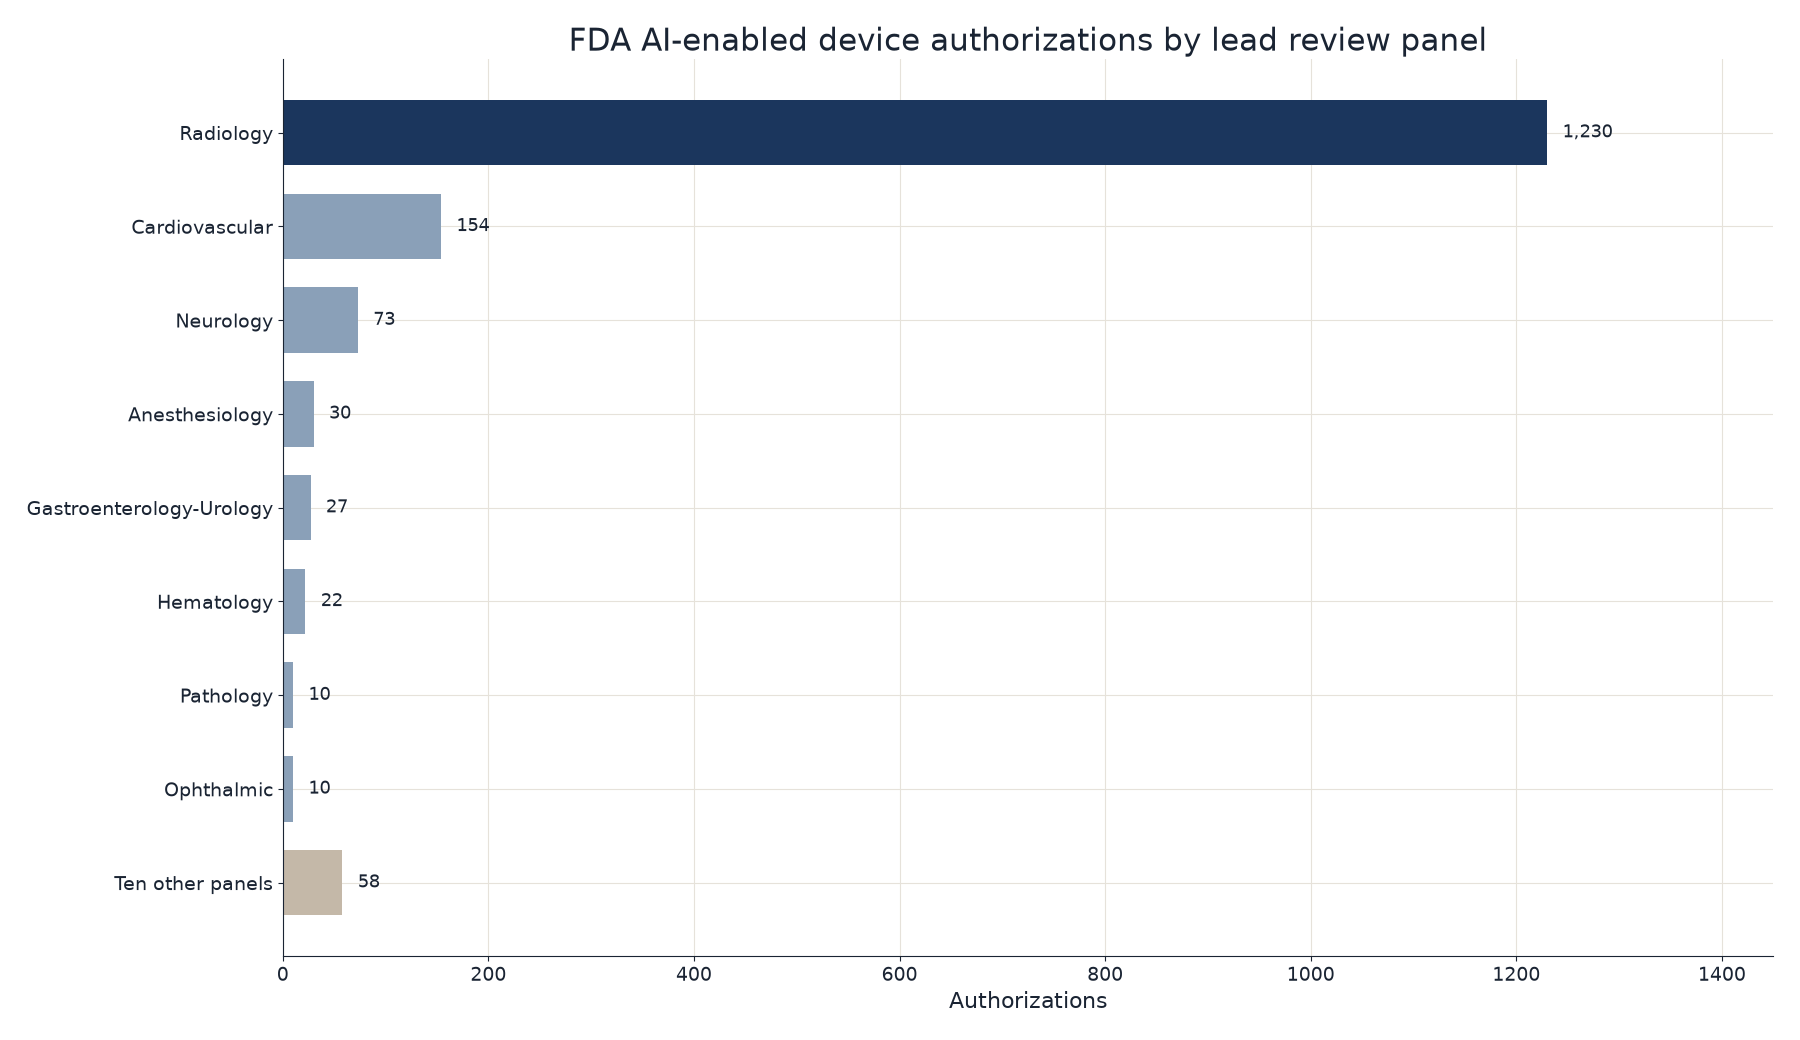
- Radiology was the lead review panel for 1,230 devices, or 76.2% of the list, followed by cardiovascular with 154 and neurology with 73.
- 977 of the authorizations, or 60.5%, have decision dates from 2023 onward.
When a company wants to sell a medical device that uses artificial intelligence in the United States, it has to go through the Food and Drug Administration. Most devices are cleared by showing they are substantially equivalent to an already marketed device, a path called 510(k). A smaller number go through De Novo authorization, which creates a new classification, or through premarket approval, the most demanding path, used for higher-risk devices. The FDA keeps a public list of AI-enabled devices it has authorized, and that list has grown quickly. The tables below count the FDA list. Devices join the list mainly when AI-related terms appear in a decision summary or classification, so the newest year keeps growing after the fact.
In the following sections, we set out yearly totals, compare clearance pathways, report the lead review panels, and list the companies that appear most often on the list.
How Many AI-Enabled Devices Has the FDA Authorized Each Year?
We counted authorizations by the year of the FDA's final decision to show how fast the list has grown. The list is short before 2018, then rises in every full year through 2025. The 2026 count runs through June 29 and will rise as the FDA adds devices after decision summaries are published.
FDA AI-enabled device authorizations by year of final decision
| Year | Authorizations | 510(k) | De Novo | Premarket approval | Radiology as lead panel |
|---|---|---|---|---|---|
| 2016 | 18 | 17 | 0 | 1 | 11 |
| 2017 | 27 | 23 | 2 | 2 | 16 |
| 2018 | 65 | 58 | 7 | 0 | 40 |
| 2019 | 80 | 80 | 0 | 0 | 51 |
| 2020 | 114 | 113 | 1 | 0 | 99 |
| 2021 | 129 | 122 | 6 | 1 | 110 |
| 2022 | 162 | 160 | 1 | 1 | 138 |
| 2023 | 226 | 219 | 6 | 1 | 178 |
| 2024 | 235 | 225 | 9 | 1 | 183 |
| 2025 | 335 | 329 | 2 | 4 | 254 |
| 2026, through June 29 | 181 | 176 | 4 | 1 | 135 |
Key Findings
- Eighty-seven devices on the list have decision dates before 2018. From 2018 through June 29, 2026, the list holds 1,527 authorizations, and 977 of those, or 60.5%, are from 2023 onward.
- The 2025 total of 335 is 100 more than 2024, a 42.6% increase. The first half of 2026, through June 29, is already larger than any full year before 2023.
- The annual total is still rising. Because the FDA adds devices with a lag, the mid-year 2026 count is a floor for the full year, and doubling it gives a misleading figure.
Which Clearance Paths Do These Devices Use?
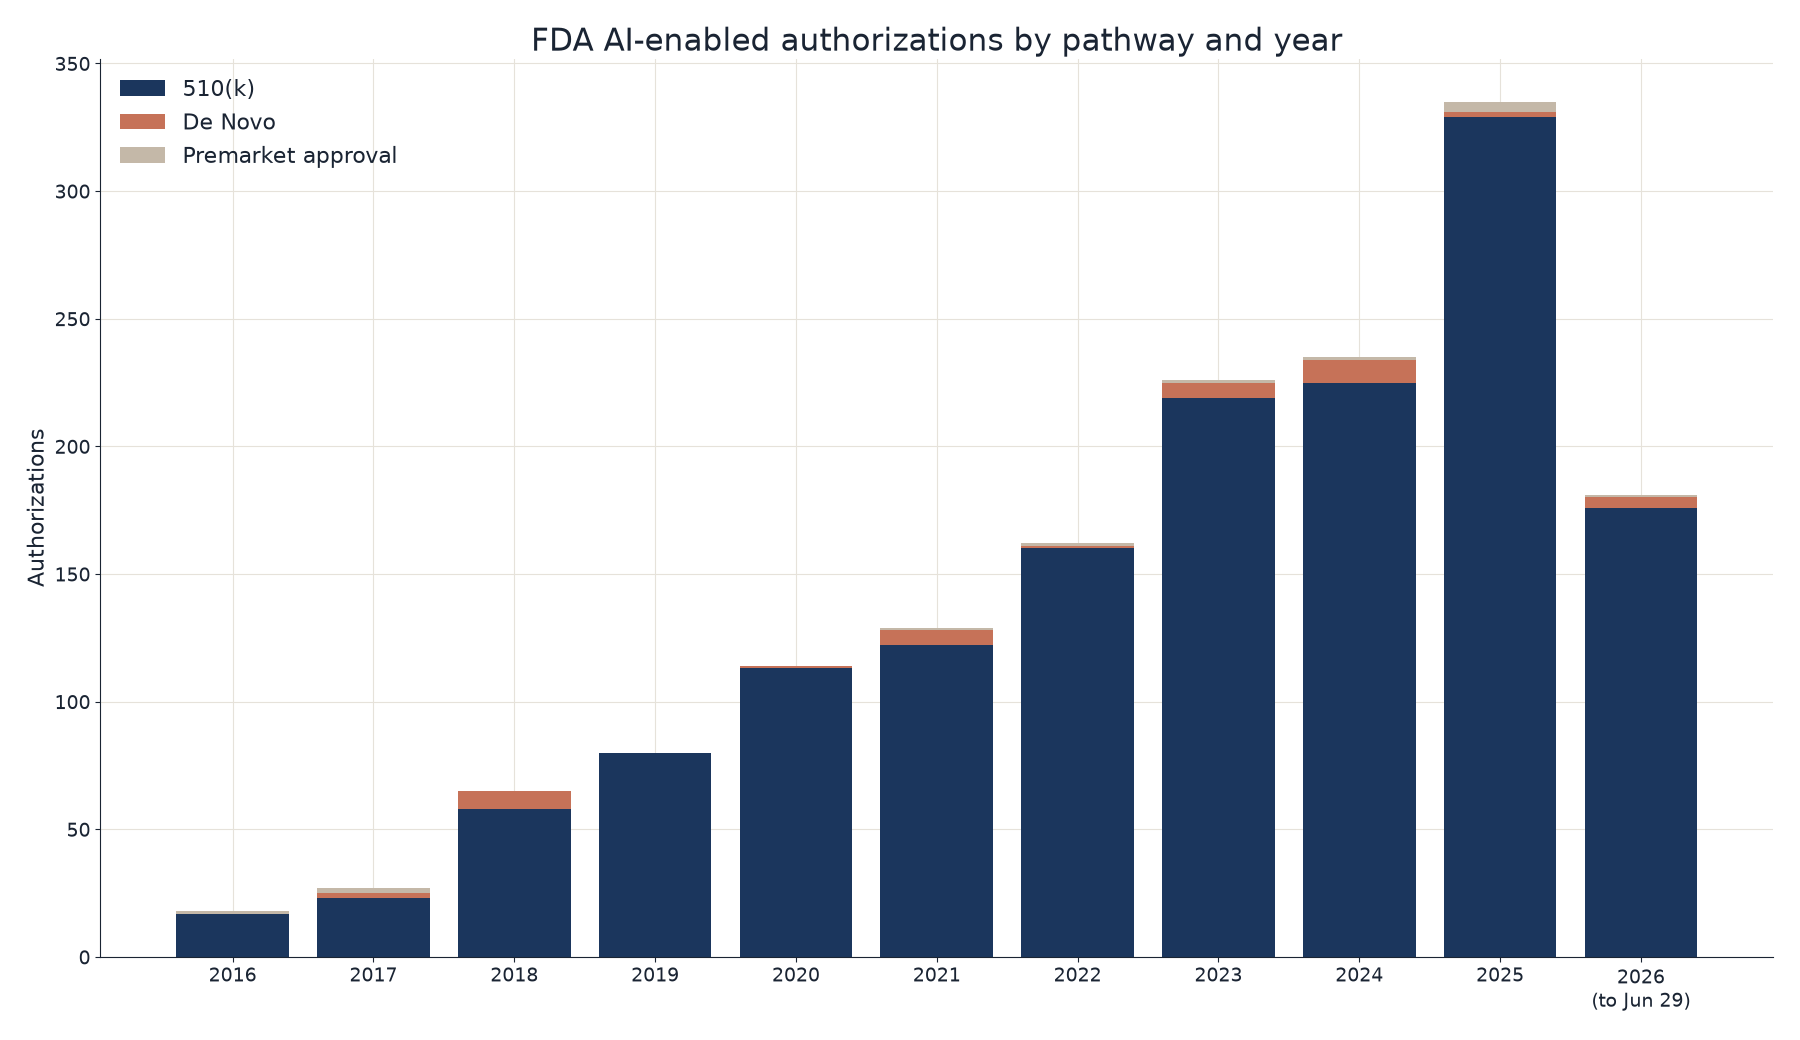
We sorted every entry by its clearance path, read from the submission number, to show how often AI devices need more than a 510(k). 510(k) is the default. De Novo and premarket approval remain uncommon, though both appear in every recent year.
FDA AI-enabled device authorizations by pathway
| Pathway | Authorizations | Share of the list |
|---|---|---|
| 510(k) | 1,553 | 96.2% |
| De Novo | 40 | 2.5% |
| Premarket approval, including supplements | 21 | 1.3% |
| Total | 1,614 | 100.0% |
Key Findings
- De Novo grants peaked at 9 in 2024, then fell to 2 in 2025, with 4 already in the June 29, 2026 count. Premarket approvals had their highest recent year in 2025, with 4, including supplements.
- Radiology devices are less likely than others to use De Novo or premarket approval. Of 1,230 radiology entries, 18 used those two paths, or 1.5%. Of the 384 entries outside radiology, 43 did, or 11.2%.
- A new AI imaging tool will usually reach the market as a 510(k) that points to a predicate device. A device in a less crowded panel is more likely to need a new classification or a premarket approval.
Which Specialties Account for the Authorizations?
We also tallied each authorization by its lead review panel, the FDA group that reviewed the submission, to see which medical specialties account for the list. The panel describes the review, and a device can still be used across several clinics.
FDA AI-enabled device authorizations by lead review panel
| Lead review panel | Authorizations | Share | 510(k) | De Novo | Premarket approval |
|---|---|---|---|---|---|
| Radiology | 1,230 | 76.2% | 1,212 | 9 | 9 |
| Cardiovascular | 154 | 9.5% | 144 | 6 | 4 |
| Neurology | 73 | 4.5% | 69 | 4 | 0 |
| Anesthesiology | 30 | 1.9% | 26 | 4 | 0 |
| Gastroenterology-Urology | 27 | 1.7% | 25 | 2 | 0 |
| Hematology | 22 | 1.4% | 22 | 0 | 0 |
| Pathology | 10 | 0.6% | 4 | 3 | 3 |
| Ophthalmic | 10 | 0.6% | 8 | 2 | 0 |
| Ten other panels | 58 | 3.6% | 43 | 10 | 5 |
| Total | 1,614 | 100.0% | 1,553 | 40 | 21 |
Key Findings
- Radiology's share of the list was 86.8% in 2020 and 74.6% in 2026 through June 29. The panel still added devices in every recent year, including 254 in 2025, while the count outside radiology rose from 24 in 2022 to 81 in 2025.
- Cardiovascular led the non-radiology panels, with 154 devices, then neurology with 73. Pathology is a small panel, 10 devices, but 6 of those 10 used De Novo or premarket approval.
- Imaging software still makes up most of the list, while the count outside radiology has more than tripled since 2022 and more panels now appear at least once.
Which Companies Appear Most Often on the List?
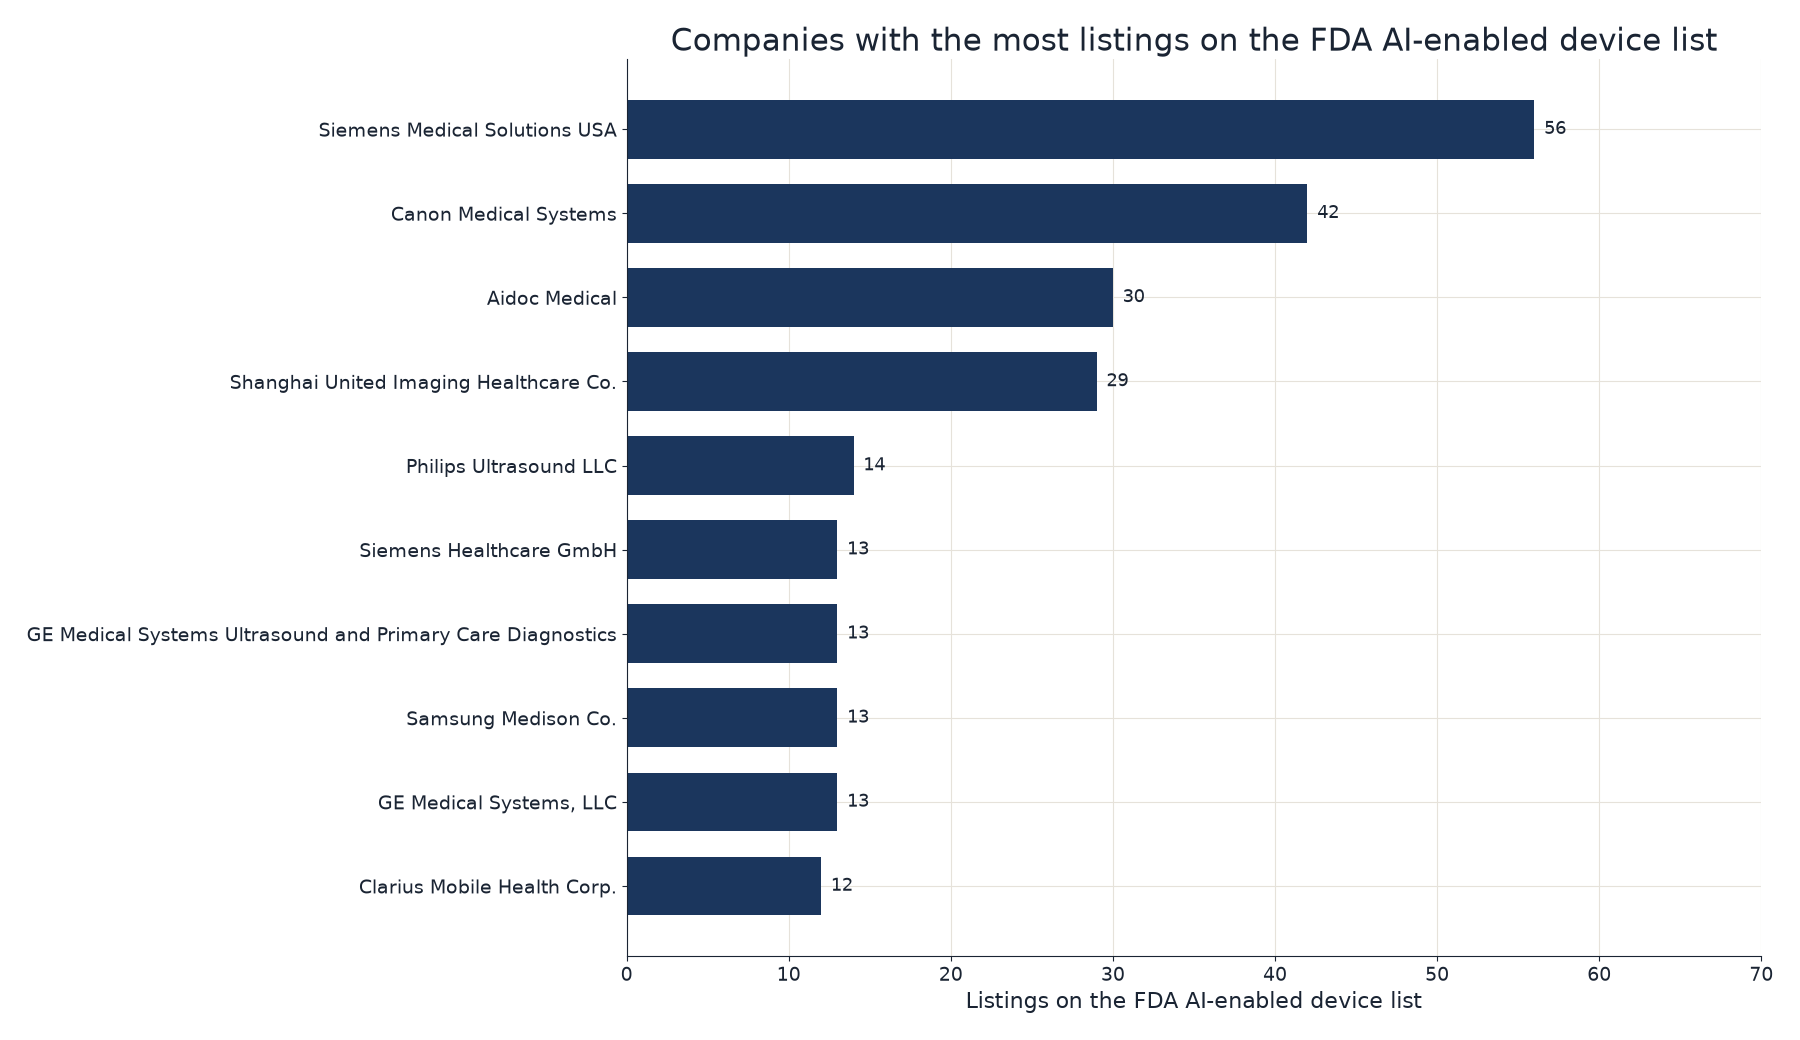
We counted the company named on each authorization to see which makers appear most often. The FDA does not standardize these names, so the same corporate family can appear under more than one string, and one company can have many clearances for related imaging systems. Names below are shown as they appear on the list.
Companies with the most listings on the FDA AI-enabled device list
| Company name as listed | Authorizations |
|---|---|
| Siemens Medical Solutions USA, Inc. | 56 |
| Canon Medical Systems Corporation | 42 |
| Aidoc Medical, Ltd. | 30 |
| Shanghai United Imaging Healthcare Co., Ltd. | 29 |
| Philips Ultrasound LLC | 14 |
| Siemens Healthcare GmbH | 13 |
| GE Medical Systems Ultrasound and Primary Care Diagnostics | 13 |
| Samsung Medison Co., Ltd. | 13 |
| GE Medical Systems, LLC | 13 |
| Clarius Mobile Health Corp. | 12 |
| Hyperfine, Inc. | 12 |
| GE Medical Systems SCS | 12 |
| Viz.ai, Inc. | 10 |
Key Findings
- Large imaging manufacturers occupy the top of the name-by-name list, alongside a smaller set of AI-software firms such as Aidoc and Viz.ai. Siemens, GE, and Philips each appear under more than one company string, so a combined corporate total would be higher than any single row.
- In 2025 and 2026 through June 29, Shanghai United Imaging Healthcare had the most listings under a single name, with 15, followed by Canon Medical Systems with 10 and Siemens Medical Solutions USA with 9.
- Each row counts how often a listed legal entity appears on the FDA list. Buyers comparing vendors should read the rows as list entries and should add up a corporate family's names before comparing groups.
What the FDA List Shows About AI in Medical Devices
The list documents a large, recent wave of authorizations, almost all of them 510(k) clearances, and most of them reviewed in radiology. It records what the FDA has authorized, and the 2026 count is still open.
The specialty mix is changing slowly. Radiology is still the majority, but its share is lower than it was in 2020, and more panels now have at least a handful of devices. The companies at the top of the list are, in many cases, the same manufacturers that already sell scanners and ultrasound systems, with a smaller group of software-only firms alongside them.
Anyone citing the number of FDA-cleared AI medical devices should give the list total with its decision-date cutoff, 1,614 through June 29, 2026, and the pathway mix.
Methodology
Scope. This report counts marketing authorizations on the FDA's public AI-Enabled Medical Device List. It is not a count of every AI-enabled device sold in the United States, and it is not a study of clinical performance. An authorization means the FDA decided the device met the applicable premarket standard for a stated use. The FDA states that the list is not comprehensive and that devices were identified mainly from AI-related terms in public summaries or classifications.
Retrieval. The official CSV was downloaded on November 13, 2026, from the FDA list page. The file's last-modified date was September 4, 2026. It contains 1,614 data rows, with dates of final decision from September 29, 1995, through June 29, 2026. The 2026 row is a partial year and will rise as decision summaries are posted. The 2026 count is not annualized.
Coding. Year is the calendar year of the Date of Final Decision field. Pathway is taken from the Submission Number prefix: K is 510(k), DEN is De Novo, and P is premarket approval, including PMA supplements. Lead panel is the Panel (Lead) field. The file spells one panel as "Clinical Toxcicology," reported here as Clinical Toxicology, the FDA panel name, in the "ten other panels" group. Company counts use the Company field as listed, without merging suffixes, punctuation variants, or corporate affiliates.
Calculations. Shares are rounded once from the raw counts. 1,553 / 1,614 = 96.2%; 40 / 1,614 = 2.5%; 21 / 1,614 = 1.3%. Radiology is 1,230 / 1,614 = 76.2%. Authorizations from 2023 through June 29, 2026, are 226 + 235 + 335 + 181 = 977, or 60.5% of 1,614. Pre-2018 devices: 1,614 minus 1,527 = 87. The 2025 increase versus 2024 is (335 - 235) / 235 = 42.6%. Radiology's 2020 share is 99 / 114 = 86.8%; its 2026 year-to-date share is 135 / 181 = 74.6%. Non-radiology devices in 2022 are 162 - 138 = 24; in 2025, 335 - 254 = 81. Radiology De Novo or PMA: 9 + 9 = 18, or 18 / 1,230 = 1.5%. Non-radiology De Novo or PMA: 40 + 21 - 18 = 43, or 43 / (1,614 - 1,230) = 11.2%. The "ten other panels" row is the 58 devices not in the eight named panels.
Sources
- AI Industry Reviews, FDA AI Medical Device Clearance Statistics: 2026 Report, count of the FDA AI-Enabled Medical Device List, conducted November 2026 (this study).
- US Food and Drug Administration, List of Artificial Intelligence-Enabled Medical Devices, page opened November 13, 2026, CSV last modified September 4, 2026, newest decision June 29, 2026: https://www.fda.gov/medical-devices/artificial-intelligence-enabled-medical-devices/list-artificial-intelligence-enabled-medical-devices
- US Food and Drug Administration, AI-enabled devices CSV (media file 178541, filename aiml-devices-csv.csv), downloaded November 13, 2026: https://www.fda.gov/media/178541/download?attachment