
Home / Research / Data Center Employment Statistics
Data Center Employment Statistics: 2026 Report
 By Darin ten Bruggencate, Founder, AI Industry Reviews · November 5, 2026
Our analysts compiled Bureau of Labor Statistics (BLS) Quarterly Census of Employment and Wages (QCEW) data for private employers in NAICS 518210 (computing infrastructure providers, data processing, web hosting, and related services) for every year from 2015 to 2025, plus the first quarter of 2026, at the national, state, and county level. We set those figures against all private industry wages, then added construction and operations job counts from company and state announcements for five large campuses, and promised and reported job counts from state audits and incentive reports in Virginia, Georgia, Washington, and Illinois. We measured employment, establishments, average weekly wages, average annual pay, peak construction headcounts, operational job targets, and incentive job commitments.
Key Findings
- Private employment in NAICS 518210, the closest official proxy for data center work, reached 483,954 in 2025, up from 296,697 in 2015, and has held near 484,000 since its 2023 peak.
- Workers in the code earned an average of $3,959 a week in 2025, 2.6 times the $1,521 average for all private industry.
- Virginia's auditors found only 15% of jobs in the code were data center jobs, and only 41% of data center jobs were classified in it.
- At the largest campuses, peak construction crews run from about 1,500 per building to over 7,500, while permanent roles run from about 50 to about 1,000.
- Illinois commitments cluster at the 20-job floor, with 29 of 34 data centers promising exactly 20 jobs, and none of the 53 jobs reported under Washington's urban exemption has been verified.
Data centers are the warehouses of the internet: large buildings full of servers that store files, run websites, and, more and more, train and serve artificial intelligence models. Companies are spending tens of billions of dollars on single campuses, and states compete for them with tax breaks that are often justified by the jobs they bring. Yet the federal government has no industry code for data centers alone, so the simple question of how many people work in them has no single official answer. The closest official measure, and what the project filings and audits add to it, tell different parts of the story.
In the following sections, we cover the national employment trend, the wage gap with the rest of the private economy, the states and counties where the industry is growing, the gap between construction and permanent jobs at large campuses, and what state audits found when they compared incentive promises with reported jobs.
How Many People Work in US Data Centers
The official proxy for data center employment is NAICS 518210, and its private payroll count rose in nine of the ten years from 2015 to 2025. The largest single-year gain came in 2022, when BLS records an increase of 78,325 jobs (20.1%) over 2021. The Census Bureau's 2017 to 2022 NAICS concordance maps 518210 one to one onto itself, so the 2022 jump does not come from codes being merged into it, although the industry's title changed that year.
NAICS 518210 private employment, establishments, and pay, United States, 2015 to 2026 Q1
| Year | Establishments | Annual average employment | Average weekly wage (USD) | Average annual pay (USD) |
|---|---|---|---|---|
| 2015 | 17,796 | 296,697 | 1,897 | 98,652 |
| 2016 | 19,486 | 301,206 | 2,036 | 105,887 |
| 2017 | 21,240 | 313,345 | 2,157 | 112,188 |
| 2018 | 23,694 | 333,499 | 2,393 | 124,456 |
| 2019 | 26,390 | 344,059 | 2,497 | 129,861 |
| 2020 | 30,108 | 361,635 | 2,652 | 137,905 |
| 2021 | 37,157 | 388,805 | 2,984 | 155,180 |
| 2022 | 46,690 | 467,130 | 3,057 | 158,975 |
| 2023 | 52,766 | 486,208 | 3,293 | 171,216 |
| 2024 | 55,256 | 483,804 | 3,746 | 194,800 |
| 2025 | 55,394 | 483,954 | 3,959 | 205,865 |
| 2026 Q1 | 55,979 | 488,955 (March) | 4,332 (quarterly) | Not published for quarters |
Quarterly weekly wages are not directly comparable with annual averages.
NAICS 518210 Private Employment, US, 2015 to 2025
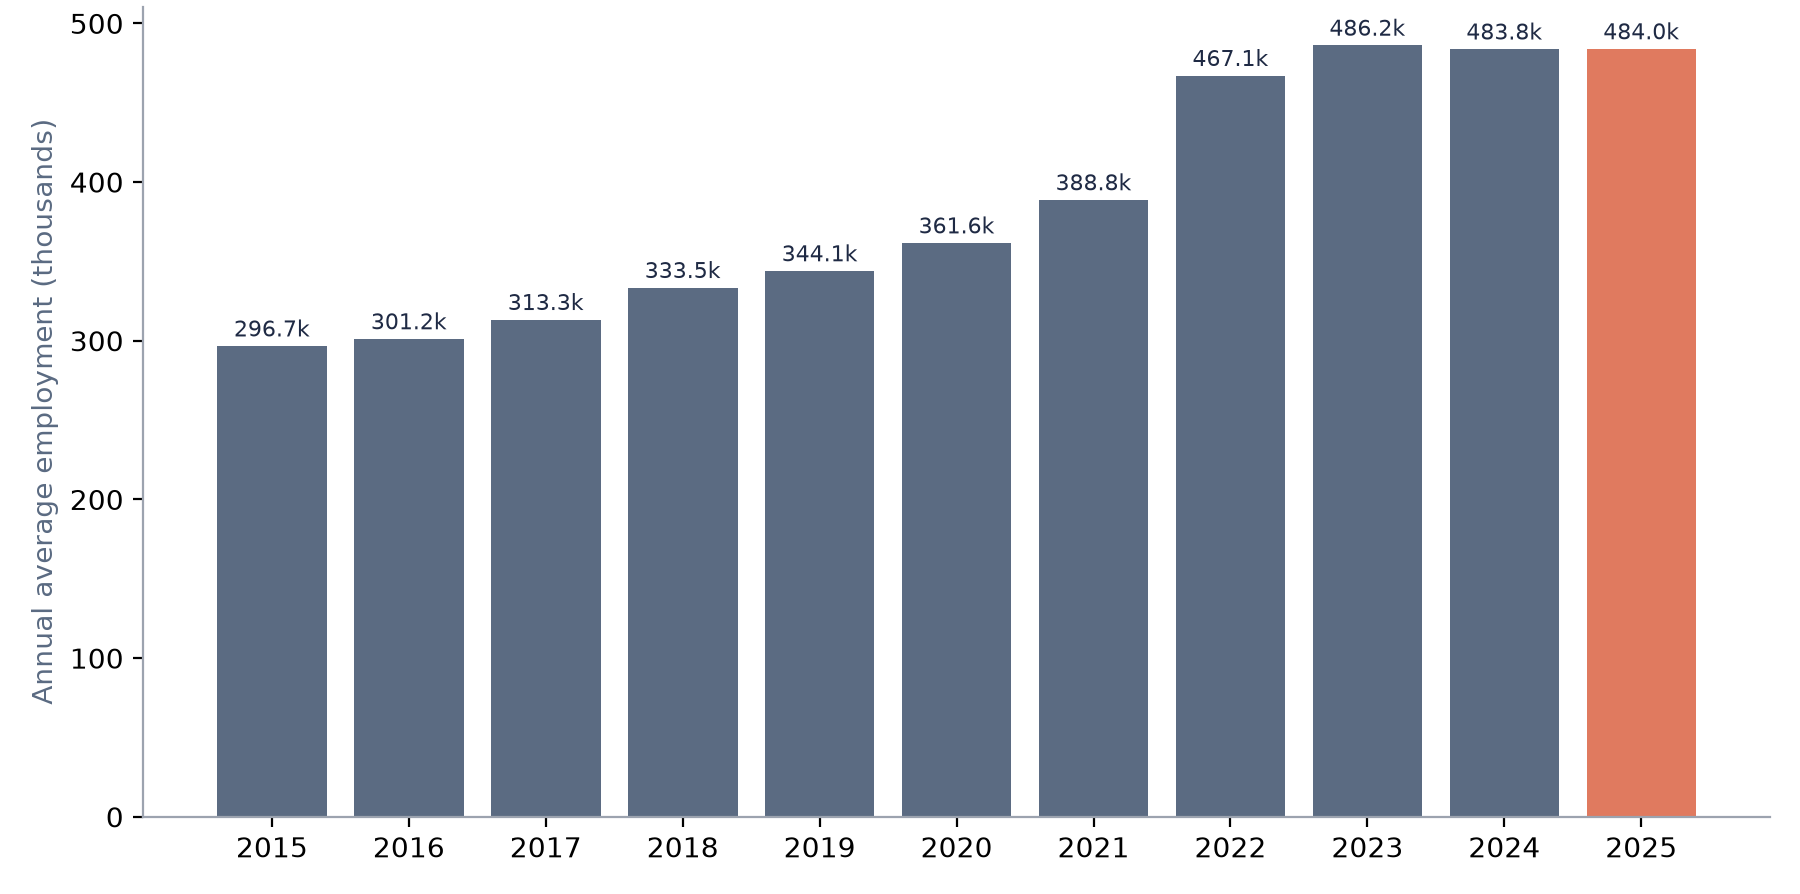
The industry is broader than data centers.
Key Findings
- Employment in the code peaked at 486,208 in 2023 and has held near 484,000 since, while establishments kept rising to 55,394 in 2025. BLS's first quarter 2026 file shows March employment of 488,955, an increase of 6,117 (1.3%) over March 2025.
- Virginia's Joint Legislative Audit and Review Commission (JLARC) warns that NAICS 518210 is a weak proxy. Its review of Virginia's 2016 data found only 15% of employment in the code was data center employment, and only 41% of data center jobs were classified in the code, with the rest spread across telecommunications and the parent firms' own industries.
- The implication is that the national 518210 count describes a broad hosting and data processing industry, not the staff inside data center buildings. Any headline claiming that number as the data center workforce overstates one part and misses the hyperscaler and telecom staff coded elsewhere.
The Wage Gap With the Rest of the Private Economy
Pay is where the industry stands out most clearly in the official data. Workers in NAICS 518210 earned an average of $3,959 a week in 2025, and average annual pay reached $205,865, compared with $79,094 for all private employers.
Average pay in NAICS 518210 compared with all private industry, United States
| Year | NAICS 518210 weekly wage (USD) | All private weekly wage (USD) | NAICS 518210 annual pay (USD) | All private annual pay (USD) |
|---|---|---|---|---|
| 2015 | 1,897 | 1,017 | 98,652 | 52,876 |
| 2020 | 2,652 | 1,236 | 137,905 | 64,247 |
| 2022 | 3,057 | 1,353 | 158,975 | 70,346 |
| 2024 | 3,746 | 1,459 | 194,800 | 75,850 |
| 2025 | 3,959 | 1,521 | 205,865 | 79,094 |
Nominal dollars.
Average Weekly Wage, NAICS 518210 vs All Private Industry
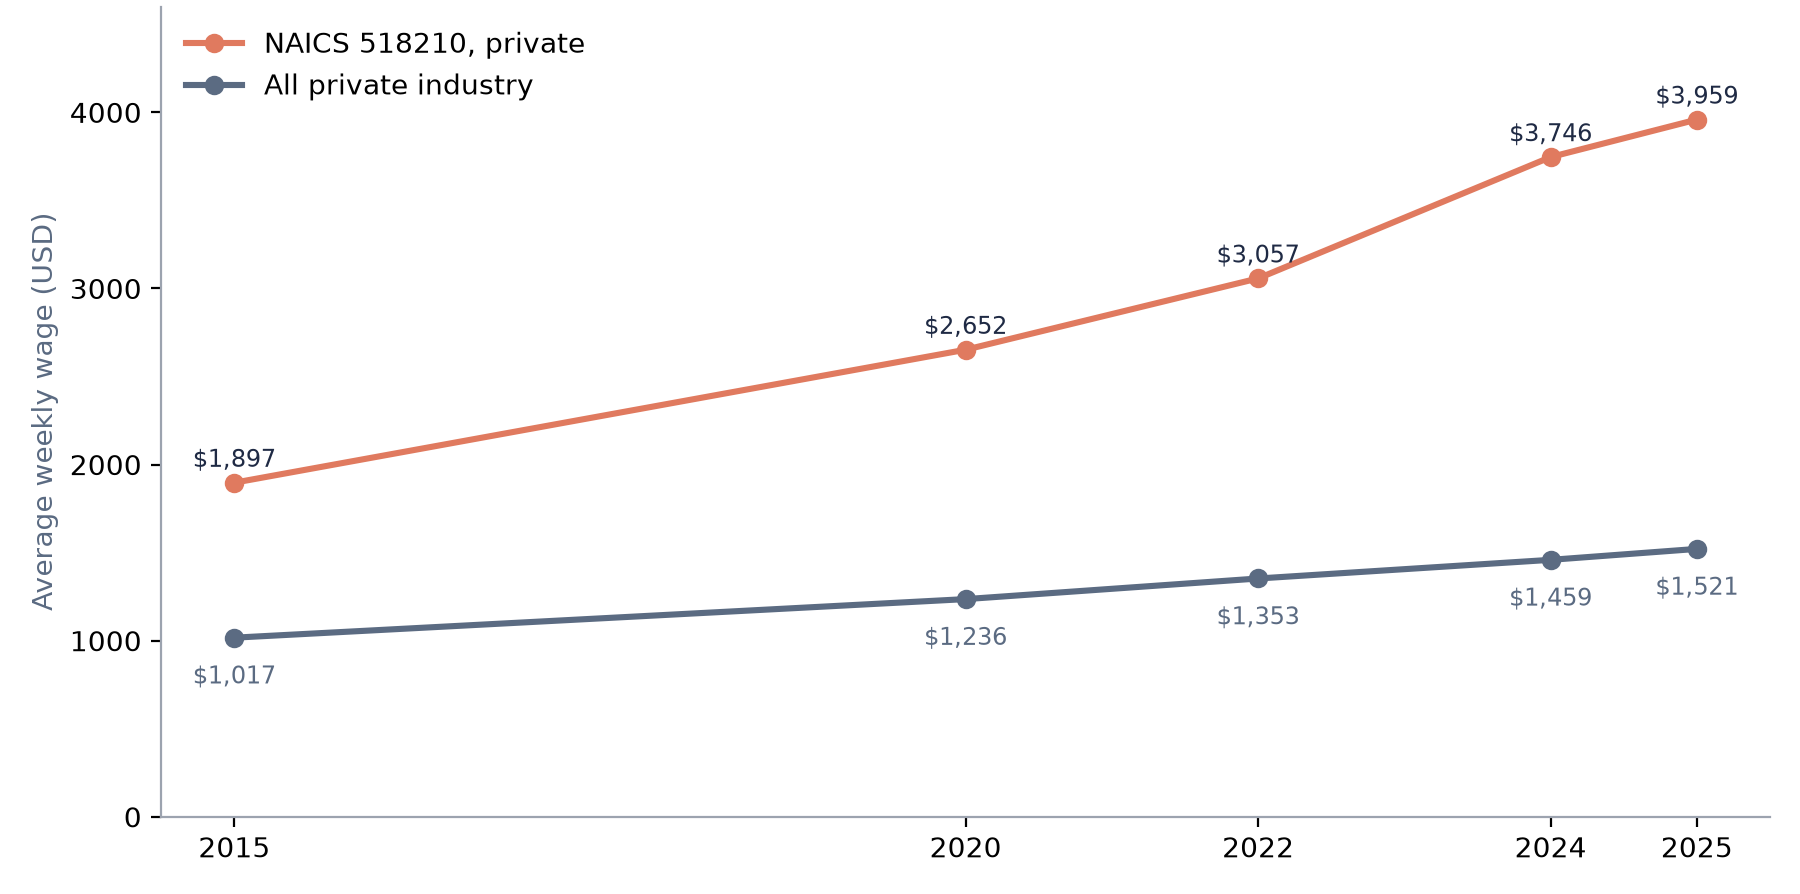
Nominal USD.
Key Findings
- The industry's weekly wage rose from $1,897 in 2015 to $3,959 in 2025, while the all private figure moved from $1,017 to $1,521 over the same years. The dollar gap widened in every year shown.
- JLARC notes that the code also covers software development and other IT services, so these averages are not a measure of operations crew pay. JLARC reports that data center employees and contractors in Virginia earn about $100,000 a year on average, with journeyman electricians at about $56 an hour.
- For communities weighing a campus, the implication is that QCEW averages for 518210 should not be quoted as the pay of local data center jobs. JLARC's site-level figure is the closer guide for technicians and trades.
Where the Industry Is Growing: States
California, Texas, and New York hold the largest NAICS 518210 payrolls, and California added the most jobs between 2020 and 2025. The growth pattern follows technology employment centers more than the states best known for data center construction.
NAICS 518210 private employment by state, 12 largest states in 2025
| State | 2015 employment | 2020 employment | 2025 employment | Change 2020 to 2025 (our calculation) | BLS change 2024 to 2025 | 2025 establishments | 2025 weekly wage, 518210 (USD) | 2025 weekly wage, all private (USD) |
|---|---|---|---|---|---|---|---|---|
| California | 33,110 | 54,033 | 81,824 | +27,791 | +3.1% | 4,452 | 6,292 | 1,869 |
| Texas | 33,910 | 38,010 | 48,266 | +10,256 | +1.4% | 3,423 | 3,452 | 1,527 |
| New York | 17,021 | 20,794 | 28,710 | +7,916 | -1.1% | 2,638 | 4,598 | 1,941 |
| Florida | 17,561 | 20,336 | 28,540 | +8,204 | -4.1% | 3,263 | 3,082 | 1,398 |
| Georgia | 8,346 | 16,052 | 24,620 | +8,568 | +0.4% | 2,305 | 3,304 | 1,426 |
| Washington | 7,405 | 14,115 | 23,335 | +9,220 | -3.4% | 1,175 | 5,149 | 1,959 |
| Virginia | 12,279 | 14,370 | 20,163 | +5,793 | +3.4% | 1,526 | 3,502 | 1,542 |
| Illinois | 10,219 | 11,314 | 16,892 | +5,578 | +5.5% | 1,690 | 4,012 | 1,560 |
| New Jersey | 9,604 | 11,191 | 16,171 | +4,980 | -1.3% | 1,017 | 4,160 | 1,668 |
| Missouri | 9,362 | 11,746 | 14,429 | +2,683 | -1.1% | 1,183 | 2,993 | 1,294 |
| Ohio | 6,043 | 8,768 | 13,195 | +4,427 | +11.3% | 1,990 | 2,594 | 1,306 |
| Colorado | 9,014 | 14,806 | 13,164 | -1,642 | -13.0% | 1,265 | 3,787 | 1,644 |
Change 2020 to 2025 is the difference between the two annual averages; the 2024 to 2025 percentage is published by BLS. BLS suppressed 2025 figures for Alaska, North Dakota, South Dakota, and Wyoming.
Key Findings
- Of the 12 states, Ohio posted the largest BLS-published gain from 2024 to 2025 at 11.3%, and Colorado the largest decline at 13.0%. Georgia's payroll rose from 8,346 in 2015 to 24,620 in 2025.
- Virginia, whose northern region JLARC describes as the largest data center market in the world, ranks seventh with 20,163 jobs in the code. That is consistent with JLARC's finding that most Virginia data center work is classified outside 518210.
- The implication for state comparisons is that 518210 rankings track where hosting and data processing firms keep staff, so a state can host many large facilities and still show modest growth in this table.
Where the Industry Is Growing: Counties
County data sharpen the point. The counties that added the most 518210 jobs from 2020 to 2025 are big technology job centers, while counties known for data center campuses show small or flat payrolls in the code.
NAICS 518210 private employment in selected counties
| County | 2015 employment | 2020 employment | 2025 employment | 2025 establishments | 2025 weekly wage, 518210 (USD) | 2025 weekly wage, all private (USD) |
|---|---|---|---|---|---|---|
| King County, WA | 5,411 | 11,299 | 19,792 | 580 | 5,536 | Not compiled |
| New York County, NY | 6,945 | 10,274 | 17,727 | 773 | 5,347 | Not compiled |
| Santa Clara County, CA | 8,320 | 7,361 | 14,593 | 449 | 11,198 | Not compiled |
| Fulton County, GA | 2,637 | 7,845 | 12,128 | 630 | 4,004 | 2,039 |
| Travis County, TX | 3,944 | 7,888 | 11,266 | 474 | 4,779 | Not compiled |
| Fairfax County, VA | 5,468 | 7,130 | 10,789 | 252 | 3,748 | Not compiled |
| Cook County, IL | 5,980 | 6,855 | 9,784 | 437 | 4,331 | 1,756 |
| Maricopa County, AZ | 8,418 | 9,454 | 9,277 | 489 | 2,889 | 1,467 |
| Dallas County, TX | 6,441 | 6,139 | 6,891 | 329 | 3,259 | 1,799 |
| Franklin County, OH | 2,133 | 2,321 | 3,741 | 267 | 2,429 | 1,415 |
| Clark County, NV | 1,295 | 1,272 | 2,052 | 252 | 3,330 | 1,268 |
| Loudoun County, VA | 2,109 | 1,733 | 2,034 | 129 | 3,720 | 1,674 |
| Tarrant County, TX | 1,467 | 915 | 1,152 | 111 | 3,387 | 1,447 |
| Prince William County, VA | 377 | 262 | 210 | 36 | 2,266 | 1,174 |
All private wages were pulled only for the data center market counties.
NAICS 518210 Employment by County, 2020 vs 2025
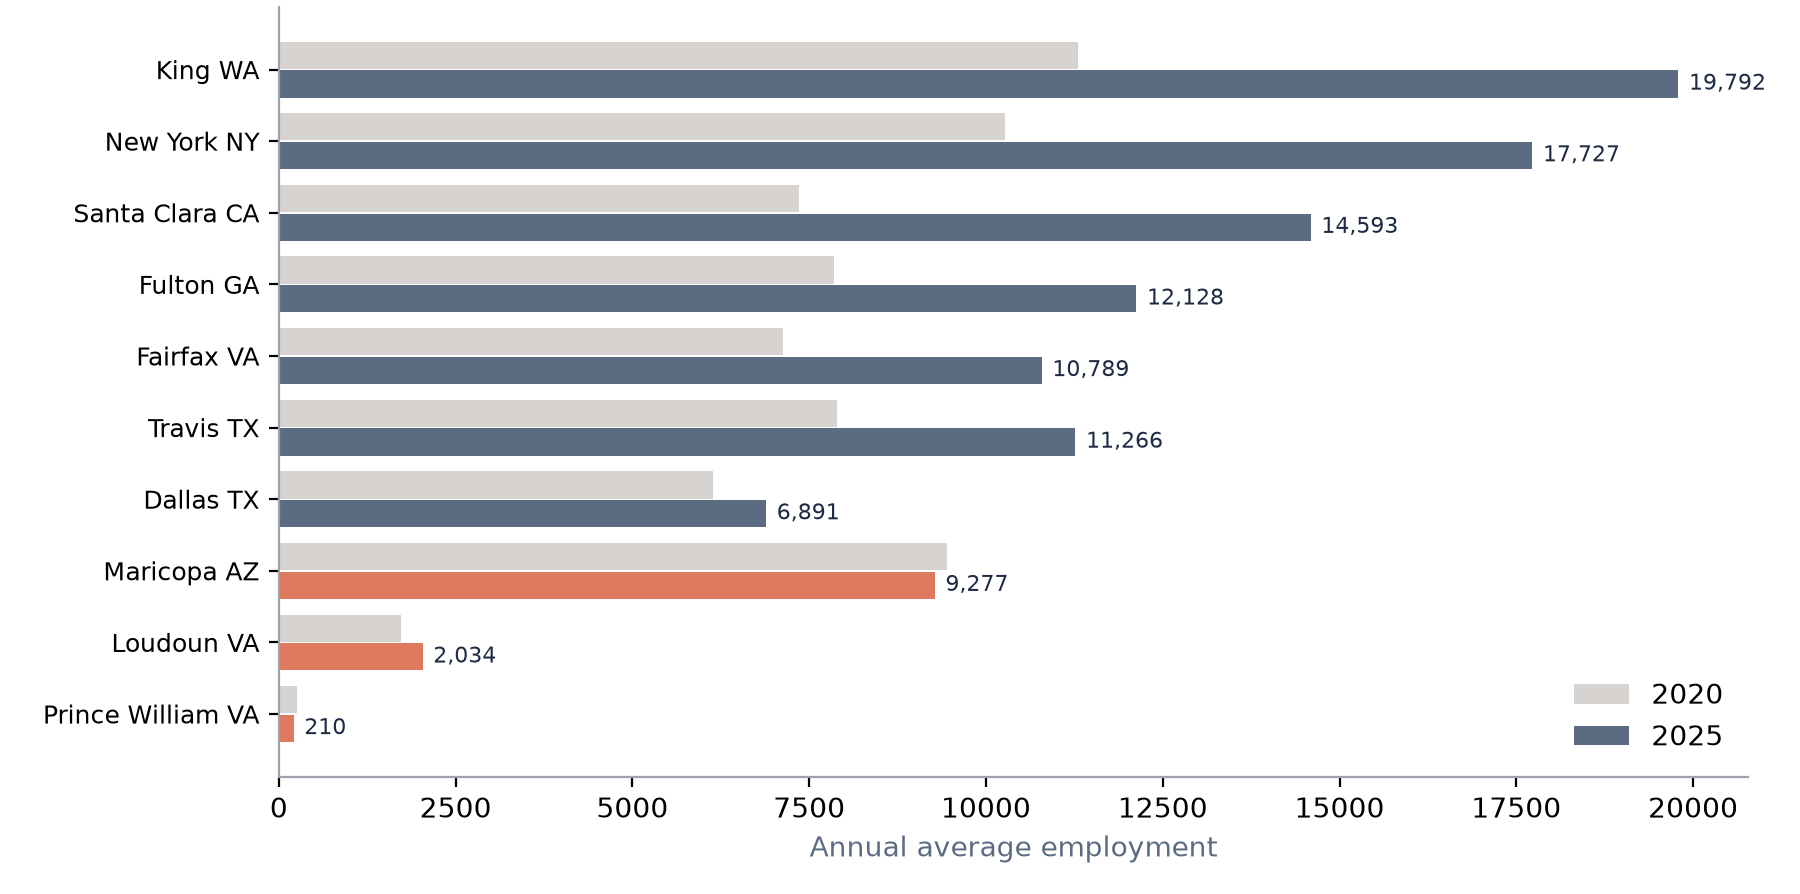
Coral marks Maricopa, Loudoun, and Prince William, three large data center markets.
Key Findings
- Excluding the unallocated statewide records, King County, Washington added the most jobs in the code from 2020 to 2025, rising from 11,299 to 19,792. New York County and Santa Clara County followed.
- Loudoun County, home of the Northern Virginia data center cluster, had 2,034 jobs in the code in 2025, below its 2,109 in 2015. Maricopa County slipped from 9,454 in 2020 to 9,277, and Prince William County fell to 210.
- The implication for local officials is that county QCEW counts for 518210 cannot verify data center job claims. JLARC found that many data center workers are reported under telecommunications and other parent-firm codes, so audits of incentive reports are the better check.
Construction Jobs Versus Permanent Jobs at Large Campuses
Company and state announcements for the largest recent projects show the same shape: thousands of construction workers at peak and a few hundred to about a thousand permanent roles. Figures below are the stated numbers in each announcement, including words such as "over" and "around".
Construction and operational job figures at selected data center projects
| Project | Stated capacity or investment | Construction workers | Operational jobs | Date |
|---|---|---|---|---|
| Meta, Richland Parish, LA (2024 announcement) | $10 billion; 1,500 MW of new renewable energy to be added with Entergy | 5,000 at peak | 500 or more direct jobs | Dec 2024 |
| Meta, Richland Parish, LA (2026 expansion) | 5 GW of compute capacity | Over 7,500 at peak | 1,000 once completed | Jul 2026 |
| Meta, El Paso, TX | 1 GW; more than $10 billion | Over 4,000 at peak | More than 300 once completed | Mar 2026 |
| Microsoft, Mount Pleasant, WI | Not stated in MW | More than 3,000 at daily peak; nearly 10,000 over two years | Nearly 550 now; around 800 after second facility | Sep 2025 and Jun 2026 |
| Amazon Web Services, Richmond County, NC | $10 billion | Not stated | At least 500 | Jun 2025 |
| Amazon Web Services, Luzerne and Bucks counties, PA | At least $20 billion | "Thousands" | At least 1,250 | Jun 2025 |
| Typical 250,000 sq ft Virginia data center building | Not applicable | About 1,500 at peak | About 50 full-time, about half contractors | Dec 2024 |
Peak Construction vs Operational Jobs at Data Center Campuses
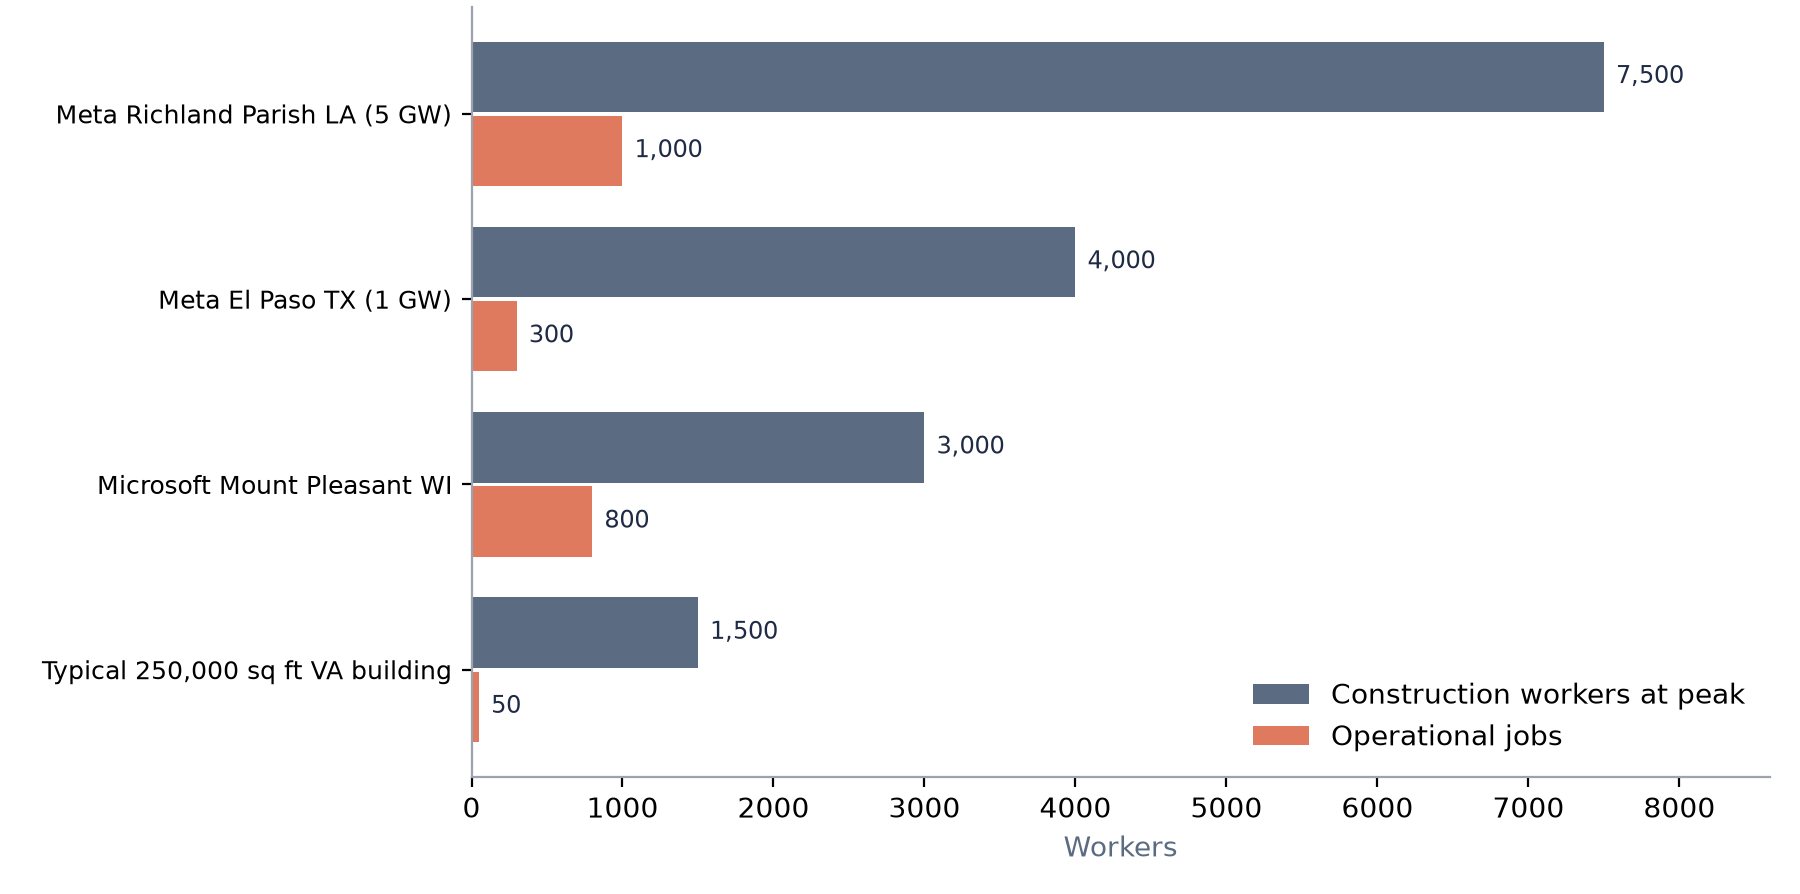
Company figures are stated targets ("over", "more than", "around").
Key Findings
- Meta raised its Richland Parish figures between announcements, from 5,000 peak construction workers and 500 or more direct jobs in 2024 to over 7,500 and 1,000 in 2026. In El Paso the stated peak crew is over 4,000 against more than 300 permanent roles.
- Microsoft's figures are the only ones here reported after completion. The company says nearly 550 full-time employees are on site supporting the first Mount Pleasant facility, and that nearly 10,000 construction workers contributed over two years.
- The implication is that permanent headcount does not rise in step with power: Meta's two stated campuses pair 1 GW with more than 300 roles and 5 GW with 1,000. Local labor effects are mostly front-loaded into a build period that JLARC puts at 12 to 18 months per building and five or more years for a full campus.
JLARC's economic model for Virginia makes the same split at the state level. It estimates the industry supports 74,000 jobs a year in Virginia, of which 59,000 come from the construction phase and 15,000 from operations, and it counts 35,000 direct construction phase jobs against 4,400 direct operations jobs. Separately, JLARC staff estimated that data center direct employees and contract workers held over 8,000 full-time jobs in fiscal 2023, and that data centers added more than 800 new full-time jobs that year.
Incentive Promises Versus Reported Jobs
Most states with data center tax breaks attach a job requirement, and a handful of recent audits and agency reports compare those requirements with what operators report. None of them yet verifies delivered jobs against signed commitments project by project, but together they show how small the permanent job side of these deals is.
Job requirements and reported or estimated jobs in state data center incentive reviews
| State and program | Job requirement | Jobs promised or reported | Cost or value of the incentive | Review |
|---|---|---|---|---|
| Virginia sales and use tax exemption | 50 jobs at 150% of local prevailing wage, plus $150 million investment (lower in distressed areas) | Over 8,000 full-time direct and contract jobs in FY23 (JLARC staff estimate); 84 jobs added per $1 million of exemption | $928.6 million in tax savings in FY23; 48 cents of state revenue returned per $1 | JLARC, Dec 2024 |
| Georgia sales and use tax exemption | Minimum jobs and investment set in statute | 1,641 operations jobs and 8,505 construction jobs attributed to the exemption in FY25 | $474.2 million forgone state revenue in FY25; $42,646 per operations job; fiscal ROI of 4% | Georgia DOAA and UGA Carl Vinson Institute, Dec 2025, revised Jan 2026 |
| Washington urban data center exemption | 3 family-wage jobs per 20,000 sq ft of new server space | 13 jobs reported for 2023 and 40 for 2024, 53 in total, none yet verified | $42.4 million in estimated savings, 2023 to 2026 | Washington JLARC, Jul 2026 preliminary |
| Illinois Data Center Investment Program | 20 new full-time jobs at 120% of county average wage, plus $250 million investment | 731 new jobs committed across 34 data centers; 29 of the 34 committed exactly 20 | $666.6 million estimated tax benefits on $10.67 billion committed investment | Illinois DCEO, 2025 annual report |
Key Findings
- Georgia's auditors first reported 28,350 construction jobs and 5,471 operations jobs, then revised the summary in January 2026 to count only the 30% of activity the researchers attributed to the exemption. The revised figures are 8,505 construction jobs and 1,641 operations jobs.
- Washington's review found that the urban exemption was used only for refurbishments and produced no new urban data centers. Beneficiaries reported 296 construction and trade jobs on those projects, and the Department of Revenue had not verified any of the 53 permanent jobs because no beneficiary had reached its six-year deadline.
- The implication is that job promises in these programs cluster at the statutory floor, as Illinois's commitments show, and verification lags by years. Reporters should treat incentive job counts as commitments unless an auditor has checked them.
Illinois's program has since closed to new entrants. The Illinois Department of Commerce and Economic Opportunity states that, per the Governor's directive on June 5, 2026, it will no longer process applications for the data center incentive program as of July 1, 2026. Virginia's exemption, by JLARC's account, is scheduled to expire in 2035 and is by far the state's largest economic development incentive.
What the Numbers Mean for Data Center Jobs
The official count and the real data center workforce are two different things. NAICS 518210 shows a well-paid industry of about 484,000 private workers that stopped growing after 2023, but Virginia's own auditors found that most data center jobs sit outside that code and most jobs in the code are not data center jobs. County figures for Loudoun, Maricopa, and Prince William make the gap visible.
The project-level figures fill part of the hole, and they point one way. Construction crews at the largest campuses run from about 1,500 per building to over 7,500 at a campus peak, while permanent roles run from about 50 per typical building to about 1,000 at the largest campus Meta has announced. Those permanent jobs are well paid, but they are few relative to the capital and power involved.
Incentive data add a caution. Illinois commitments sit at the 20-job floor for most projects, Washington's reported jobs are unverified, and Georgia's auditors corrected their job figures the month after publishing them. Promised job counts in these deals are best read as minimums written into contracts.
So if you are judging a data center's job impact, compare the peak construction figure with the operational count in the developer's own filing, and look for a state audit before relying on either.
Data Collection and Methodology
We downloaded BLS QCEW open data files for NAICS 518210 for each year from 2015 to 2025 and for the first quarter of 2026, and kept private ownership records (own code 5) at the national, state, and county level. All private industry comparisons use QCEW industry 10 (total, all industries) with private ownership. Employment figures are annual averages of monthly employment, and wages are nominal dollars as published. The 2026 row uses March employment and the quarterly average weekly wage, which BLS computes differently from the annual average.
NAICS 518210 is broader than data centers. It covers computing infrastructure providers, data processing, web hosting, and related services, and it excludes many data center workers who are counted under their employer's main industry, such as telecommunications carriers and large technology firms. We relied on JLARC's Virginia analysis for the size of that gap and did not adjust any QCEW figure. BLS suppresses records that could identify individual employers; suppressed states and counties are left out, not estimated. County tables exclude the statewide "unknown or undefined" county records that BLS publishes.
Change from 2020 to 2025 in Table 3 is the simple difference between two published annual averages. The 2024 to 2025 percentage changes are BLS's own over-the-year figures. We did not compute ratios, per-worker rates, or per-megawatt rates. Project job figures are taken as stated in company and state announcements, including qualifiers, and none has been verified after completion except where the company reports current staffing. Incentive figures are taken from the audit or agency report cited; Georgia figures use the revised January 2026 summary.
We did not use BLS OEWS or Census County Business Patterns, because neither isolates data center work more cleanly than QCEW and both lag it. Data were retrieved on October 23, 2026. The compact data file qcew_518210_private.csv contains the national, state, and county QCEW rows used in Tables 1, 3, and 4.
Sources
- AI Industry Reviews, Data Center Employment Statistics: 2026 Report, aggregation of BLS QCEW, company, and state data (this study).
- U.S. Bureau of Labor Statistics, QCEW Open Data, industry 518210 annual averages, 2015 to 2025. https://data.bls.gov/cew/data/api/2025/a/industry/518210.csv (one file per year)
- U.S. Bureau of Labor Statistics, QCEW Open Data, industry 518210, first quarter 2026. https://data.bls.gov/cew/data/api/2026/1/industry/518210.csv
- U.S. Bureau of Labor Statistics, QCEW Open Data, area US000 annual averages (2015, 2020, 2022, 2024, 2025) and industry 10 annual averages, 2025. https://data.bls.gov/cew/data/api/2025/a/area/US000.csv and https://data.bls.gov/cew/data/api/2025/a/industry/10.csv
- U.S. Bureau of Labor Statistics, QCEW Open Data, county area files, 2025. https://data.bls.gov/cew/data/api/2025/a/area/51107.csv (one file per county)
- U.S. Bureau of Labor Statistics, QCEW Introduces NAICS 2022 Industry Coding. https://www.bls.gov/cew/classifications/industry/naics-2022.htm
- U.S. Census Bureau, 2017 to 2022 NAICS concordance. https://www.census.gov/naics/concordances/2017_to_2022_NAICS.xlsx
- Joint Legislative Audit and Review Commission (Virginia), Data Centers in Virginia, Report 598, December 2024. https://jlarc.virginia.gov/pdfs/reports/Rpt598.pdf
- Georgia Department of Audits and Accounts, Tax Incentive Evaluation: Georgia Data Center Sales and Use Tax Exemption, December 2025, revised January 2026. https://www.audits2.ga.gov/wp-content/uploads/2025/12/Data-Center-Tax-Exemption-Summary-Revised.pdf
- WABE, Revised audit reveals Georgia data centers' economic impact massively overstated. https://www.wabe.org/georgia-data-centers-economic-impact-massively-overstated/
- Washington Joint Legislative Audit and Review Committee, 2026 tax preference review: Data Centers in Urban Counties, preliminary report, July 2026. https://leg.wa.gov/jlarc/taxReports/2026/data/1/report.html
- Illinois Department of Commerce and Economic Opportunity, Data Center Investment Program 2025 Annual Report. https://dceo.illinois.gov/content/dam/soi/en/web/dceo/aboutdceo/reportsrequiredbystatute/2025-data-centers-annual-report.pdf
- Illinois Department of Commerce and Economic Opportunity, Data Center Investment Tax Exemptions and Credits. https://dceo.illinois.gov/expandrelocate/incentives/datacenters.html
- Louisiana Economic Development, Meta Selects Northeast Louisiana as Site of $10 Billion Artificial Intelligence Optimized Data Center, December 2024. https://www.opportunitylouisiana.gov/news/meta-selects-northeast-louisiana-as-site-of-10-billion-artificial-intelligence-optimized-data-center-governor-jeff-landry-calls-investment-a-new-chapter-for-state
- Meta Data Centers, Deepening our investment in Richland Parish, Louisiana, July 13, 2026. https://datacenters.atmeta.com/2026/07/deepening-our-investment-in-richland-parish-louisiana/
- Meta Data Centers, Big things are happening, El Paso!, March 26, 2026. https://datacenters.atmeta.com/2026/03/big-things-are-happening-el-paso/
- Microsoft On the Issues, Made in Wisconsin: The world's most powerful AI datacenter, September 18, 2025. https://blogs.microsoft.com/on-the-issues/2025/09/18/made-in-wisconsin-the-worlds-most-powerful-ai-datacenter/
- Microsoft Source, Microsoft completes construction on first datacenter facility in Mount Pleasant, Wisconsin, June 23, 2026. https://news.microsoft.com/source/2026/06/23/microsoft-completes-construction-on-first-datacenter-facility-in-mount-pleasant-wisconsin/
- Office of the Governor of North Carolina, Governor Stein Announces Amazon Plans to Invest $10 Billion in North Carolina for AI Infrastructure, June 4, 2025. https://governor.nc.gov/news/press-releases/2025/06/04/governor-stein-announces-amazon-plans-invest-10-billion-north-carolina-ai-infrastructure
- Office of the Governor of Pennsylvania, Amazon to invest $20 billion in Pennsylvania, June 2025. https://www.pa.gov/governor/newsroom/2025-press-releases/gov-announces-amazon-to-invest--20b-in-pa--largest-capital-inves
Facts on this page
- Those permanent jobs are well paid, according to JLARC, but they are few relative to the capital and power involved.
Table and chart sources
- Table, NAICS 518210 private employment, establishments, and pay, United States, 2015 to 2026 Q1: Source: BLS QCEW open data, industry 518210, private ownership, annual averages 2015 to 2025 and first quarter 2026 (AI Industry Reviews aggregation). Quarterly weekly wages are not directly comparable with annual averages.
- Chart, NAICS 518210 private employment, US, 2015-2025: Source: BLS QCEW open data, NAICS 518210 (computing infrastructure providers, data processing, web hosting, and related services), private ownership, annual averages. The industry is broader than data centers. AI Industry Reviews aggregation (Sources 2 and 3).
- Table, Average pay in NAICS 518210 compared with all private industry, United States: Source: BLS QCEW open data, area US000, private ownership, industries 518210 and 10 (total, all industries), annual averages (AI Industry Reviews aggregation). Nominal dollars.
- Chart, Average weekly wage, NAICS 518210 vs all private industry: Source: BLS QCEW open data, annual averages, private ownership (US000, industry 518210 and industry 10). Nominal USD. AI Industry Reviews aggregation (Source 4).
- Table, NAICS 518210 private employment by state, 12 largest states in 2025: Source: BLS QCEW open data, industry 518210 and industry 10, private ownership, state annual averages (AI Industry Reviews aggregation). Change 2020 to 2025 is the difference between the two annual averages; the 2024 to 2025 percentage is published by BLS. BLS suppressed 2025 figures for Alaska, North Dakota, South Dakota, and Wyoming.
- Table, NAICS 518210 private employment in selected counties: Source: BLS QCEW open data, industry 518210 and industry 10, private ownership, county annual averages (AI Industry Reviews aggregation). All private wages were pulled only for the data center market counties.
- Chart, NAICS 518210 employment by county, 2020 vs 2025: Source: BLS QCEW open data, private ownership, county annual averages. Coral marks Maricopa, Loudoun, and Prince William, three large data center markets. AI Industry Reviews aggregation (Source 5).
- Table, Construction and operational job figures at selected data center projects: Sources: Louisiana Economic Development; Meta Data Centers; Microsoft; Office of the Governor of North Carolina; Office of the Governor of Pennsylvania; JLARC Report 598.
- Chart, Peak construction vs operational jobs at data center campuses: Sources: Meta (Jul 2026, Mar 2026), Microsoft (Sep 2025 peak; Jun 2026 expected total after second facility), and Virginia JLARC Report 598 (Dec 2024). Company figures are stated targets ("over", "more than", "around"). AI Industry Reviews aggregation (Sources 8 and 15 to 18).
- Table, Job requirements and reported or estimated jobs in state data center incentive reviews: Sources: JLARC Report 598; Georgia Department of Audits and Accounts; Washington JLARC; Illinois Department of Commerce and Economic Opportunity.
- Table, Construction and operational job figures at selected data center projects, date and source by row: Meta, Richland Parish, LA (2024 announcement): Louisiana Economic Development; Meta, Richland Parish, LA (2026 expansion): Meta; Meta, El Paso, TX: Meta; Microsoft, Mount Pleasant, WI: Microsoft; Amazon Web Services, Richmond County, NC: NC Governor; Amazon Web Services, Luzerne and Bucks counties, PA: PA Governor; Typical 250,000 sq ft Virginia data center building: JLARC.