
Home / Research / Data Center Electricity Price Impact Statistics
Data Center Electricity Price Impact Statistics: 2026 Report
 By Darin ten Bruggencate, Founder, AI Industry Reviews · November 11, 2026
Our analysts compiled state retail electricity prices from the Energy Information Administration (EIA) for 2019 through July 2026, five PJM Interconnection capacity auctions, the PJM market monitor's estimates of data center impacts, utility commission orders and bill estimates, and federal data on data center electricity use, to understand how data center demand is reaching electricity prices as of Q4 2026. For each figure we recorded whether the source ties it to data centers or reports a general price change, because retail price data do not separate the causes.
Key Findings
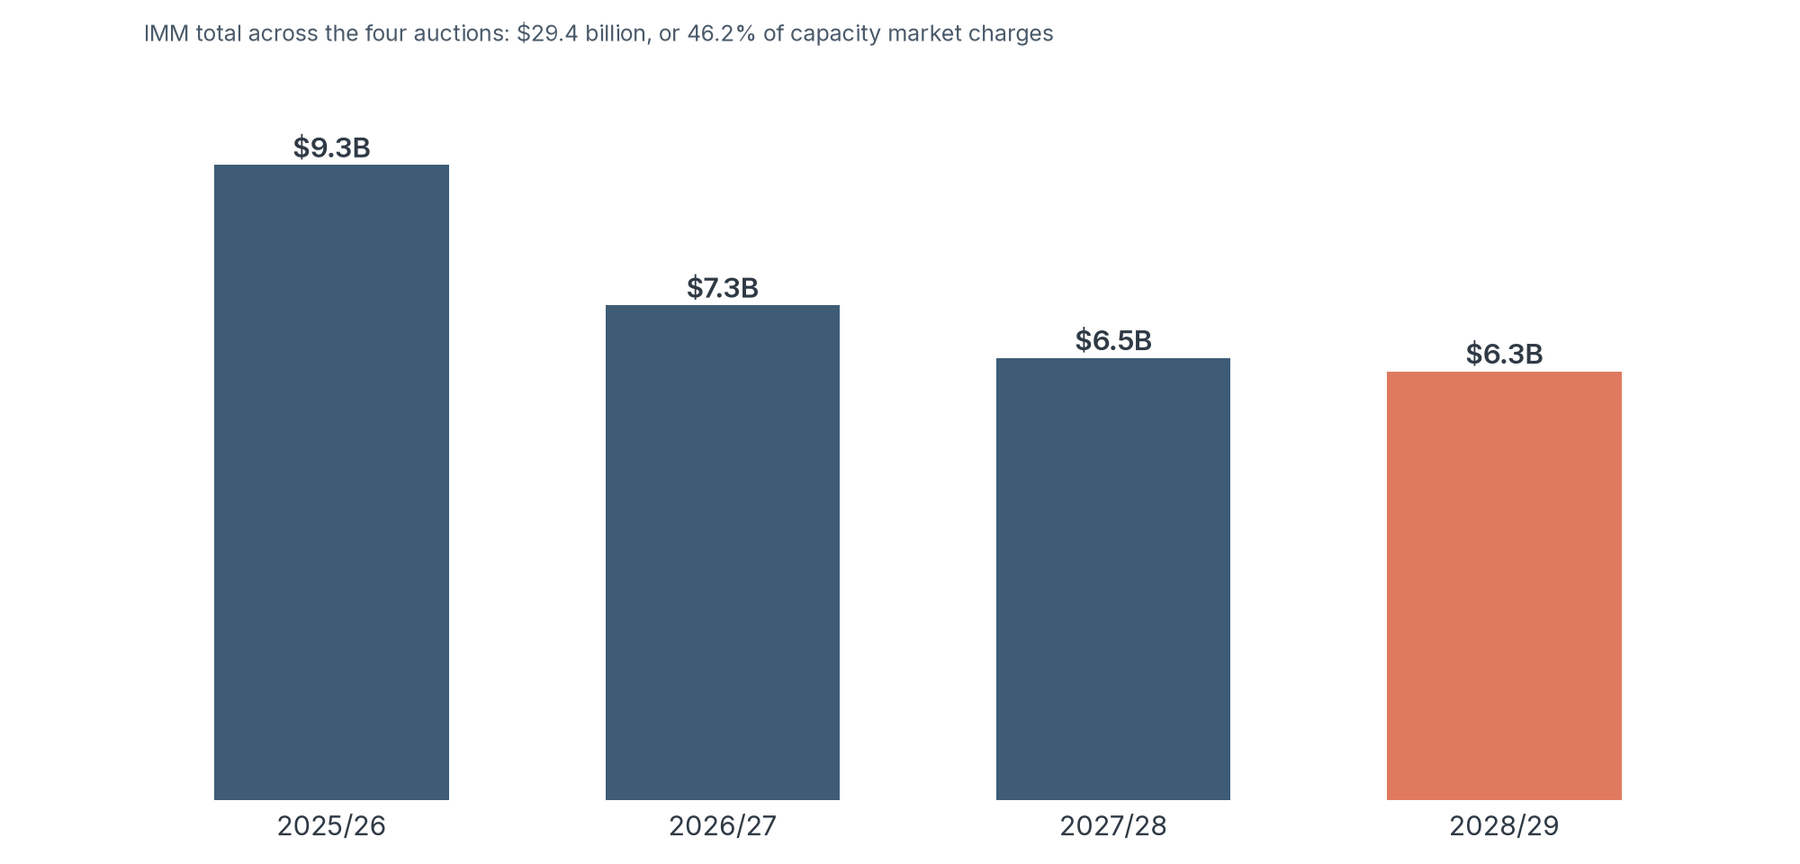
- PJM's market monitor attributes $29.4 billion of capacity charges across the 2025/26 to 2028/29 auctions to data center load, or 46.2% of the total.
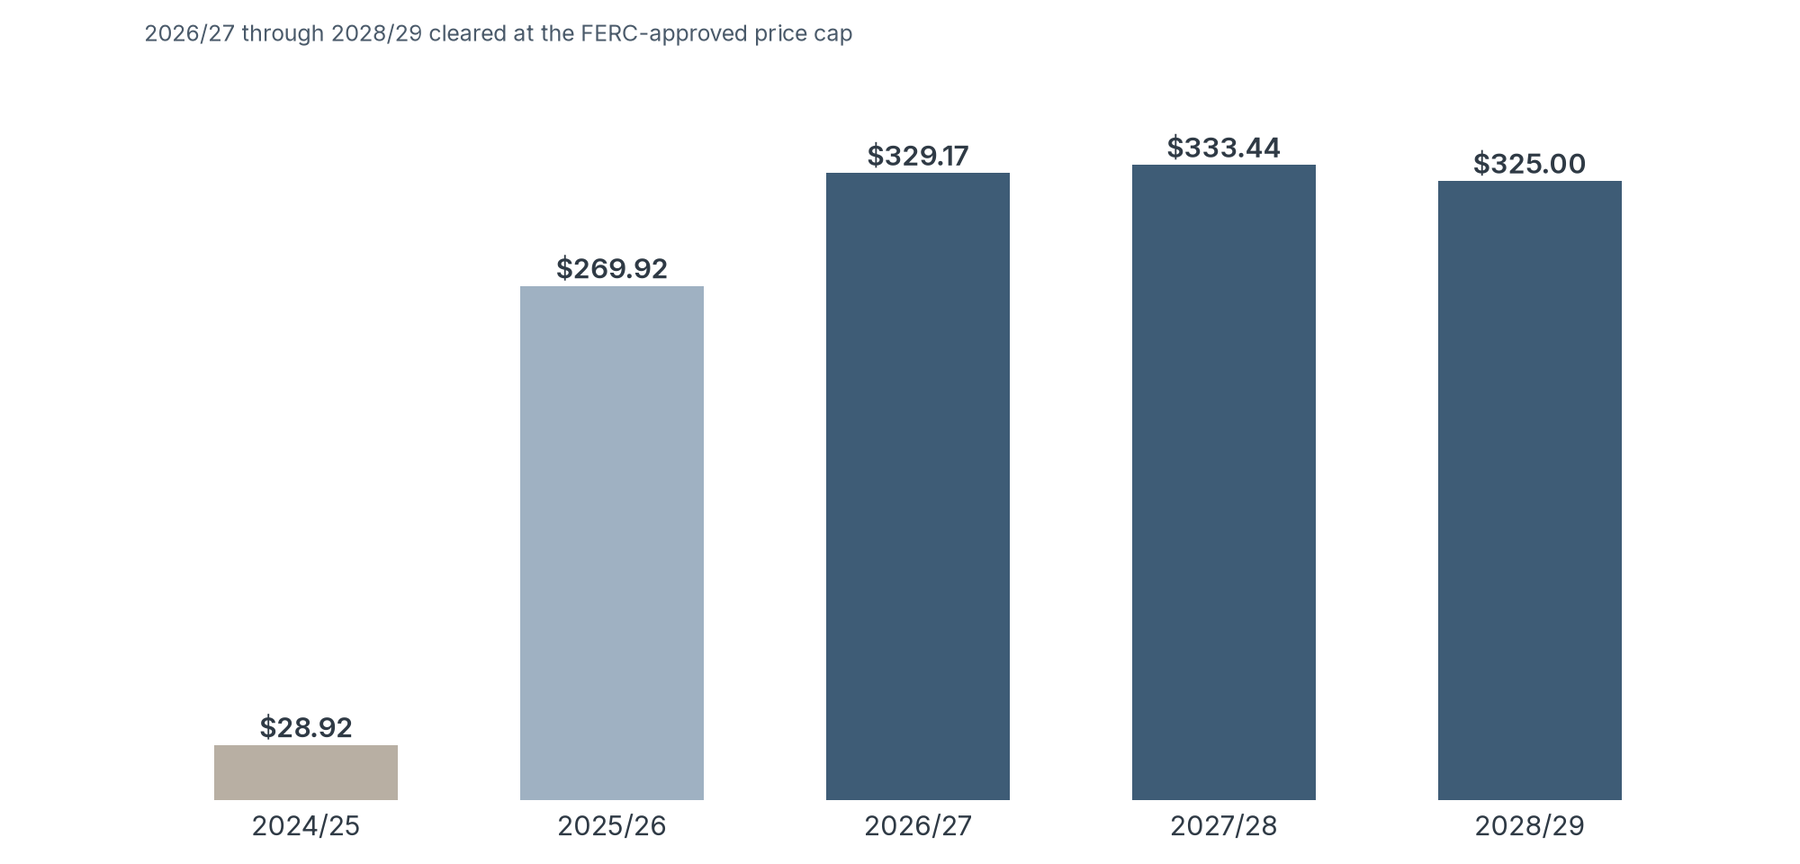
- PJM's capacity auction price rose from $28.92 per MW-day for 2024/25 to $269.92 for 2025/26, and the next three auctions cleared at the price cap, between $325.00 and $333.44.
- Residential electricity prices in the six PJM jurisdictions we tracked rose 8.7% to 17.8% from January to July 2026 over the same months of 2025, against 6.9% nationally.
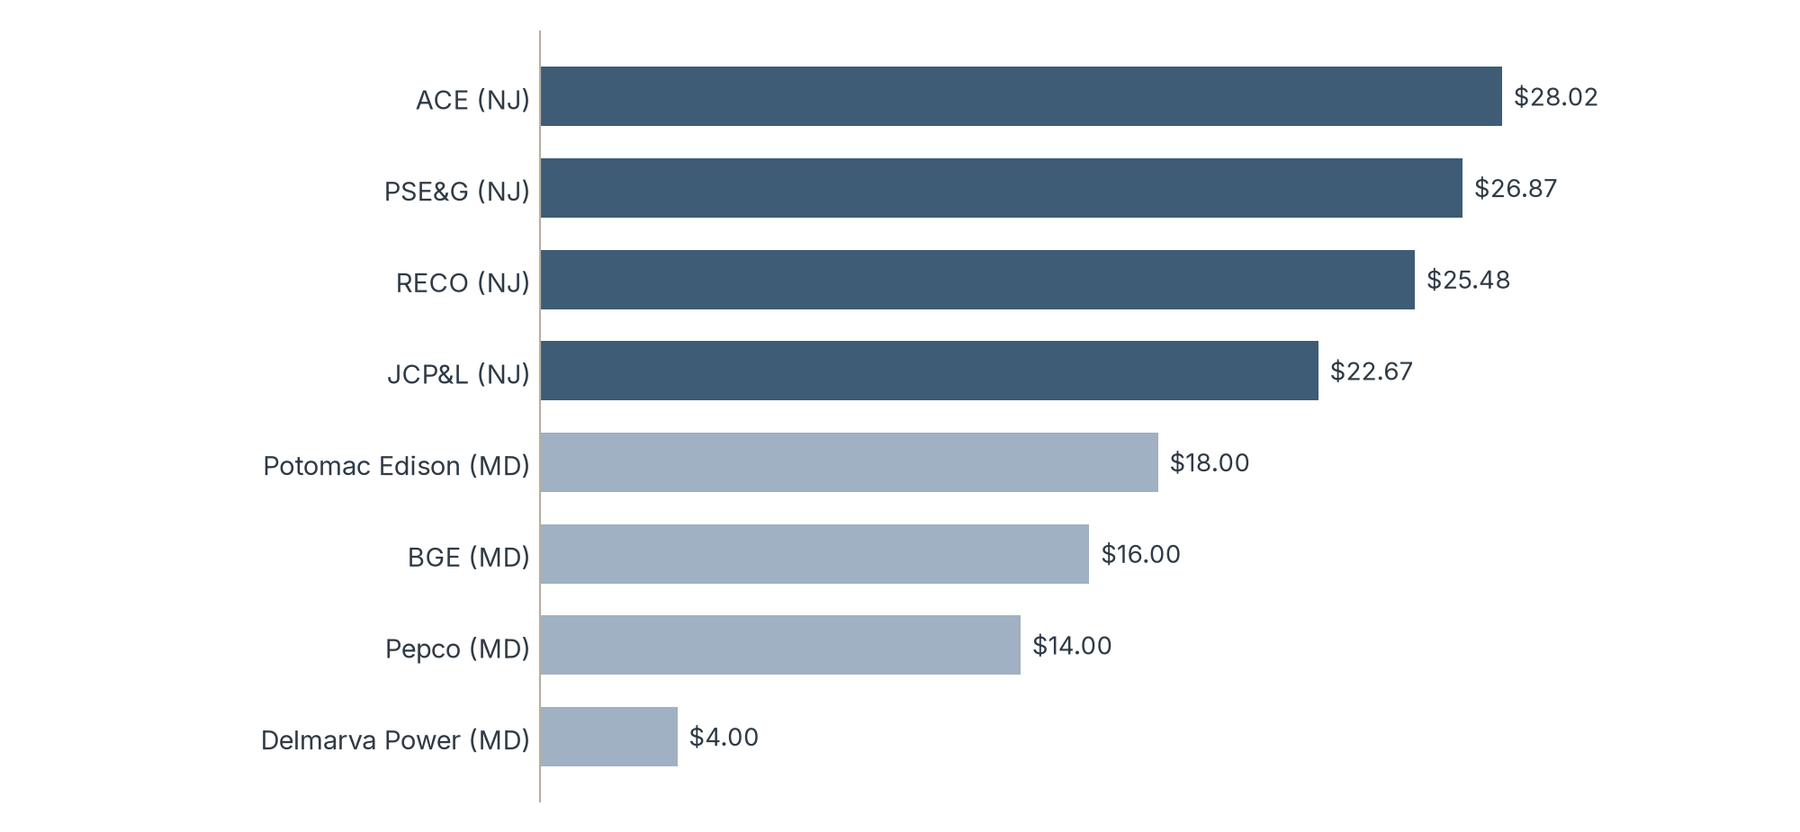
- New Jersey households faced bill increases of $22.67 to $28.02 a month from June 1, 2025, which regulators tied mainly to PJM capacity costs, and Maryland's consumer advocate put the 2025/26 capacity impact at $4 to $18 a month.
- Data centers used about 4.4% of US electricity in 2023, and Virginia's commercial electricity sales rose 60.5% from 2019 to 2025, against 10.5% nationally.
In February 2025, New Jersey's Board of Public Utilities certified the results of the state's annual power supply auction and warned households what was coming. A typical PSE&G residential customer using 650 kWh a month would see the bill rise from $155.84 to $182.71 on June 1, an increase of 17.24%, and customers of the other three regulated utilities faced increases of 17.23% to 20.20%. Board President Christine Guhl-Sadovy said "PJM's recent capacity auction results are the main driver of these increases," and the Board cited capacity costs "caused by rapidly increasing electricity demand growth driven by data center growth and other factors". That chain from data center demand to household bills is now measured in several places.
In the following sections, we break down how much electricity data centers use, state retail price changes from 2019 to 2025 and in 2026 so far, PJM capacity auction prices, the share of capacity costs the market monitor attributes to data centers, published monthly bill impacts, and the large-load tariffs regulators approved for Dominion, AEP Ohio, and Georgia Power.
How Much Electricity Data Centers Use
Federal estimates of data center electricity use and EIA sales data show where demand is growing fastest, which is where any price effect would start.
A report by Lawrence Berkeley National Laboratory (LBNL) for the Department of Energy found that data centers consumed about 4.4% of total US electricity in 2023. Their use rose from 58 TWh in 2014 to 176 TWh in 2023, and the report projects 325 to 580 TWh by 2028, or about 6.7% to 12% of US electricity. The 2028 range is a projection.
EIA does not report data center sales separately. Its analyses track the growth through commercial sector sales, which it says rose fastest in states with "rapid development of large-scale computing facilities such as data centers".
Commercial electricity sales, 2019 and 2025, data-center-heavy states
| State | 2019 sales (TWh) | 2025 sales (TWh) | Change | Rank of 51 |
|---|---|---|---|---|
| Oregon | 16.42 | 29.77 | 81.3% | 1 |
| Virginia | 53.98 | 86.62 | 60.5% | 3 |
| Arizona | 29.42 | 37.62 | 27.9% | 7 |
| Ohio | 46.01 | 57.73 | 25.5% | 8 |
| Texas | 142.00 | 174.68 | 23.0% | 10 |
| Georgia | 47.41 | 57.13 | 20.5% | 12 |
| United States | 1,360.88 | 1,503.31 | 10.5% | n/a |
Key Findings
- All six states grew commercial sales at roughly two to eight times the national rate. Texas added 32.7 TWh and Virginia 32.6 TWh, the two largest gains in the country.
- EIA said Virginia's growth "is largely driven by a concentration of data centers, as well as electric vehicle adoption and building electrification". Its May 2026 article, published before the final 2025 file, put the increase at "nearly 30.0 million megawatthours."
- For utility planners and regulators, these figures show where load is growing, not what that growth did to rates. The price effect depends on how each market and commission recovers the cost of serving it.
Retail Electricity Prices by State, 2019 to 2025
We compared residential and commercial price changes in the six data-center-heavy states with the national average and with the states where prices rose fastest.
All prices in this section are nominal annual averages, not adjusted for inflation.
Average retail electricity prices, 2019 and 2025, nominal cents per kWh
| State | Residential 2019 | Residential 2025 | Change | Rank of 51 | Commercial 2019 | Commercial 2025 | Change |
|---|---|---|---|---|---|---|---|
| Oregon | 11.01 | 15.46 | 40.4% | 7 | 8.85 | 9.80 | 10.7% |
| Ohio | 12.38 | 16.90 | 36.5% | 12 | 9.72 | 11.58 | 19.1% |
| Texas | 11.76 | 15.40 | 31.0% | 18 | 8.06 | 8.56 | 6.2% |
| Virginia | 12.07 | 15.28 | 26.6% | 28 | 8.18 | 9.95 | 21.6% |
| Georgia | 11.76 | 14.74 | 25.3% | 30 | 10.02 | 11.53 | 15.1% |
| Arizona | 12.43 | 15.26 | 22.8% | 33 | 10.25 | 12.45 | 21.5% |
| United States | 13.01 | 17.23 | 32.4% | n/a | 10.68 | 13.37 | 25.2% |
Residential Electricity Price Change by State, 2019 to 2025
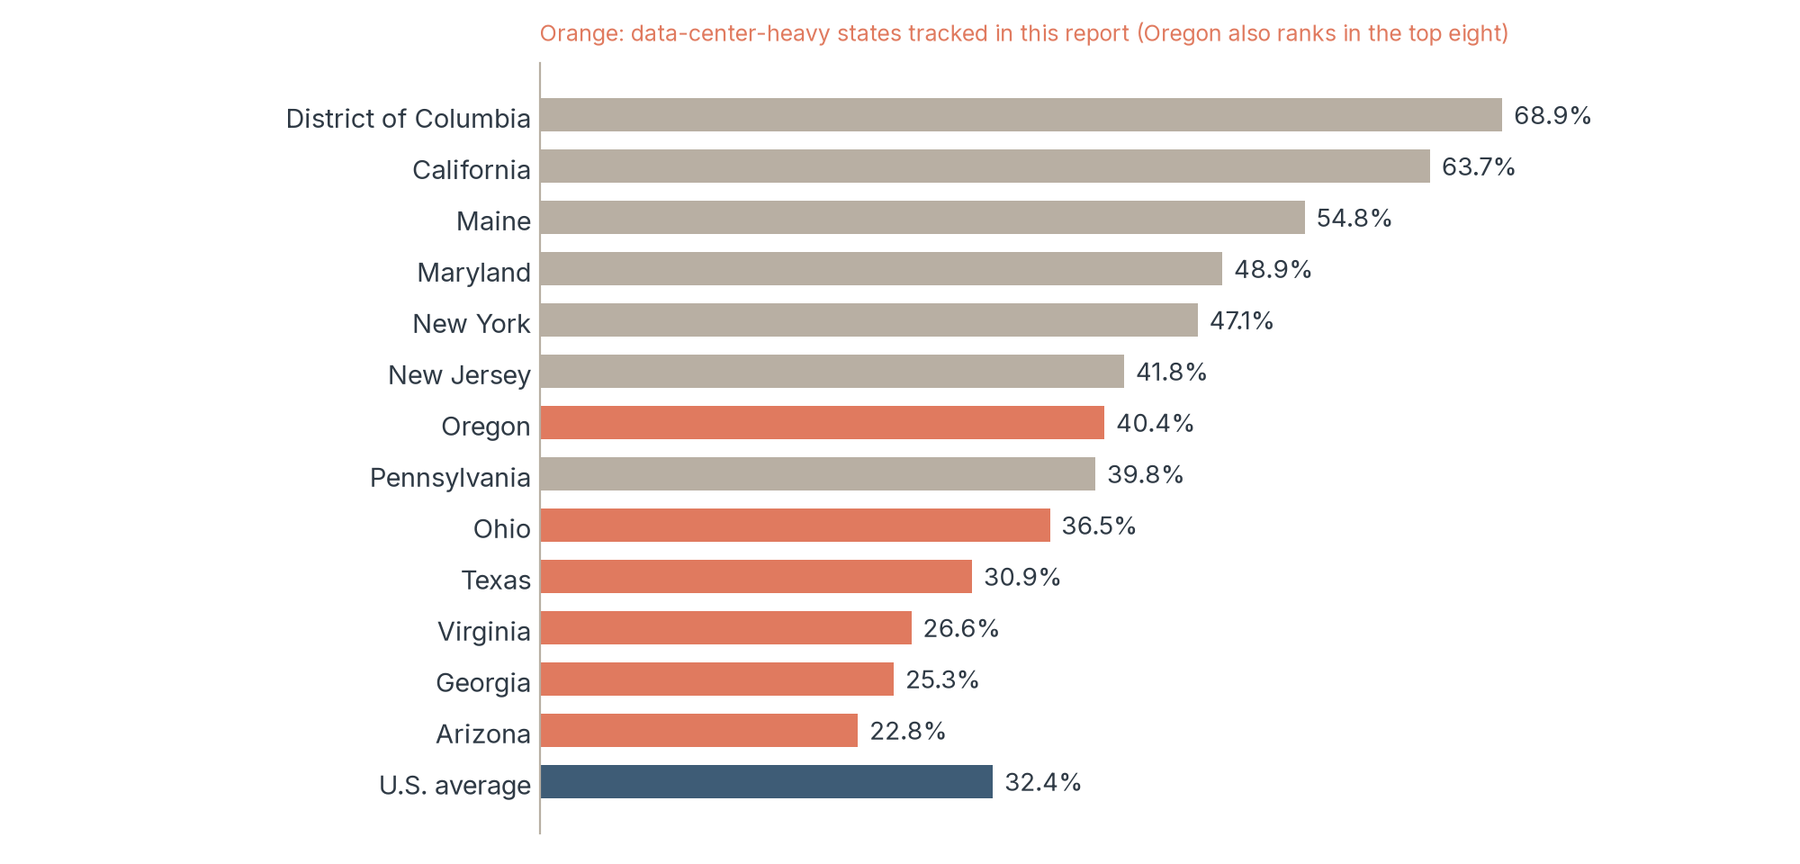
The single-year view differs. From 2024 to 2025, Virginia's residential price rose 6.0% and Ohio's 5.7%, against 4.6% nationally, while Texas rose 3.1% and Arizona 2.4%.
Key Findings
- The six jurisdictions with the largest residential increases, led by the District of Columbia and California, all saw commercial sales fall from 2019 to 2025. Oregon is the only data-center-heavy state in the top eight.
- Virginia, Texas, Georgia, and Arizona had residential increases below the national rate, while Oregon and Ohio were above it. All six had commercial price increases below the national rate.
- For policymakers, statewide averages show no simple pattern of data center states paying more. LBNL and the Brattle Group found that from 2019 to 2024 "states with the highest load growth generally saw retail electricity prices decline in real terms," while cautioning that "higher growth can increase prices if supply and delivery infrastructure is constrained and costly".
Retail Prices in 2026 So Far
EIA's monthly data for January through July 2026 give the first full look at prices after PJM's higher capacity costs reached bills, so we compared them with the same months of 2025.
PJM coordinates the grid in all or parts of 13 states and the District of Columbia, including Maryland, New Jersey, Ohio, Pennsylvania, and Virginia, but not Texas, Georgia, Arizona, or Oregon. Utilities began paying the 2025/26 capacity price on June 1, 2025.
Average retail prices, January to July, 2025 and 2026, nominal cents per kWh
| State | PJM state | Residential 2025 | Residential 2026 | Change | Commercial 2025 | Commercial 2026 | Change |
|---|---|---|---|---|---|---|---|
| District of Columbia | Yes | 20.93 | 24.66 | 17.8% | 19.90 | 23.56 | 18.4% |
| Maryland | Yes | 18.75 | 21.30 | 13.6% | 14.29 | 17.18 | 20.2% |
| Virginia | Yes | 14.88 | 16.83 | 13.1% | 9.23 | 11.21 | 21.5% |
| Ohio | Yes | 16.55 | 18.70 | 13.0% | 11.15 | 13.83 | 24.0% |
| Pennsylvania | Yes | 18.70 | 21.04 | 12.5% | 12.12 | 13.97 | 15.3% |
| New Jersey | Yes | 22.07 | 23.98 | 8.7% | 16.44 | 17.78 | 8.2% |
| Texas | No | 15.20 | 16.06 | 5.7% | 8.59 | 8.56 | -0.3% |
| Georgia | No | 14.74 | 15.40 | 4.5% | 11.72 | 11.70 | -0.2% |
| Oregon | No | 15.19 | 15.40 | 1.4% | 10.59 | 10.57 | -0.2% |
| Arizona | No | 15.30 | 15.44 | 0.9% | 12.58 | 12.14 | -3.5% |
| United States | n/a | 17.01 | 18.19 | 6.9% | 13.23 | 13.97 | 5.6% |
Key Findings
- Every PJM jurisdiction in the table had a residential increase above the national 6.9%, and every non-PJM state was below it. Commercial prices in the four non-PJM states were flat or lower.
- Capacity costs in PJM's total wholesale cost rose 207.1% in January to June 2026 over the same months of 2025, and energy costs rose 47.7%. EIA's retail data do not split prices by cost component, so the table cannot show how much of each state's change came from capacity.
- For households in PJM states, five of the seven 2025 comparison months came before the 2025/26 capacity price took effect, so the 2026 figures are the first year-over-year view of it. PJM membership is still one difference among many, including fuel costs, weather, and state rate decisions.
PJM Capacity Auction Prices, 2024/25 to 2028/29
PJM's Base Residual Auctions (BRAs) set the price utilities pay for generating capacity in each delivery year, and they are where data center demand first shows up as a cost.
PJM Base Residual Auction results for the RTO, nominal dollars
| Delivery year | Clearing price ($/MW-day) | Cleared capacity (MW UCAP) | Cleared MW times price |
|---|---|---|---|
| 2024/25 | $28.92 | 147,478.9 | $2.2 billion |
| 2025/26 | $269.92 | 135,684.0 | $14.7 billion |
| 2026/27 | $329.17 | 134,205.3 | $16.1 billion |
| 2027/28 | $333.44 | 134,478.1 | $16.4 billion |
| 2028/29 | $325.00 | 138,317.8 | $16.4 billion |
PJM Capacity Auction Clearing Prices, 2024/25 to 2028/29 ($/MW-day)
Key Findings
- The RTO price rose more than ninefold from 2024/25 to 2025/26, and the next three auctions all cleared at a FERC-approved price cap. PJM estimated that without the cap and floor, the 2027/28 auction would have cleared at $529.80 per MW-day.
- PJM said the 2026/27 peak load forecast rose by more than 5,400 MW, "driven largely by data center expansion, electrification and economic growth", and that nearly 5,100 MW of the 5,250 MW increase for 2027/28 "is attributable to data center demand".
- For load-serving utilities and their customers, the last two auctions also fell short of PJM's reliability requirement, by 6,623 MW for 2027/28 and 6,831.3 MW for 2028/29. The 2028/29 report said the 1,374.5 MW rise in forecast load was "largely due to additional Large Loads".
How Much of the Capacity Cost the Market Monitor Attributes to Data Centers
Monitoring Analytics, PJM's Independent Market Monitor (IMM), estimates how much data center load added to capacity auction revenues, the most direct published measure of a data center cost.
The IMM reruns each auction without data center load and compares the revenue to the actual result. Its conclusion for the 2027/28 auction was that "data center load growth is the primary reason for recent and expected capacity market conditions," including "high prices".
Data center load and IMM-estimated capacity revenue impact by auction
| Delivery year | All data center load in forecast (MW) | Added capacity revenue from data center load |
|---|---|---|
| 2025/26 | 7,927 | $9,332,103,858 |
| 2026/27 | 11,993 | $7,271,197,971 |
| 2027/28 | 17,071 | $6,497,653,512 |
| 2028/29 | 21,470 | $6.3 billion |
| Four-auction total | n/a | $29.4 billion |
Capacity Revenue the PJM Market Monitor Attributes to Data Center Load, by Delivery Year
Key Findings
- For 2027/28, the IMM said data center load raised capacity revenues by 65.5% over what they would have been without it. For 2028/29, it said data center load accounted for 38.2% of capacity charges, and across the four auctions for 46.2% of all capacity charges.
- The IMM said the 2027/28 impact was smaller than 2026/27 because prices without data center load would also have been higher that year, due to a higher reliability requirement in the MAAC region. The falling dollar figures do not mean data center load shrank; the load in the forecast grew about 2.7 times from 2025/26 to 2028/29.
- For PJM customers, the IMM put the total cost of wholesale power in January to June 2026 at $114.50 per MWh, against $103.40 without the data center impact on capacity revenues for 2025/26 and 2026/27, an increase of $11.11 or 9.7%. The IMM's position is that data center load should be "removed from the capacity market and procured through a dedicated auction".
Published Monthly Bill Impacts
We collected the residential bill estimates published by PJM, state regulators, and consumer advocates, because bills are where households feel these costs.
No regulator we found publishes a bill figure that isolates data centers. The figures below measure capacity costs or full rate changes.
Published residential bill impacts
| Jurisdiction | Utility or area | Monthly impact | What it measures |
|---|---|---|---|
| New Jersey | ACE, JCP&L, PSE&G, RECO | $22.67 to $28.02 (17.23% to 20.20%) | Supply auction result from June 1, 2025, 650 kWh |
| Maryland | Potomac Edison, BGE, Pepco, Delmarva | $4.00 to $18.00 | 2025/26 capacity market impact |
| Virginia | Dominion | $11.24 in 2026, plus $2.36 in 2027 | Approved base-rate increase, all drivers |
| PJM region | Some customers | 1.5% to 5% | PJM's expected effect of the 2026/27 cap price |
Published Monthly Residential Bill Increases Tied to PJM Capacity Costs
Key Findings
- Maryland's consumer advocate said the 2025/26 capacity prices were "driven primarily by" three factors, the first being "increases in demand, driven largely by data centers," alongside market rule changes and plant retirements. It said capacity rose from 8% of wholesale power costs in 2023 to about 27% after the 2024 auction.
- The Maryland PSC ordered BGE to shift recovery of some supply costs into lower-usage months, so BGE customers pay the increase over three months in fall 2025 and three in spring 2026.
- For households, the Dominion figure is the cost of a general rate case, not a data center charge. PJM said its 1.5% to 5% estimate depends on "how load serving entities and states pass on wholesale costs to consumers," and that customers in the BGE and Dominion zones could see a drop because their 2026/27 prices fell.
Rate Cases and Large-Load Tariffs: Dominion, AEP Ohio, and Georgia Power
Regulators in three states have approved terms meant to make large data centers carry more of the cost of serving them.
Large-load tariff and rate decisions
| Utility | Regulator and date | Who it covers | Key terms |
|---|---|---|---|
| Dominion Energy Virginia | Virginia SCC, Nov 25, 2025 | New GS-5 class for customers demanding 25 MW or more, from Jan 1, 2027 | Minimum payment of 85% of contracted distribution and transmission demand and 60% of generation demand |
| AEP Ohio | PUCO, July 9, 2025 | New data centers, with the minimum-demand schedule above 25 MW | Minimum of 85% of subscribed capacity for 12 years, including a four-year ramp, plus an exit fee and collateral |
| Georgia Power | Georgia PSC, Jan 23, 2025 | New customers using more than 100 MW | Upstream generation, transmission, and distribution costs can be billed; contracts up to 15 years; minimum bills; PSC review of contracts |
Key Findings
- In Dominion's biennial review, the SCC approved base-rate increases of $565.7 million for 2026 and $209.9 million for 2027, against requests of $822 million and $345 million. It said the new class is meant "to help insulate ratepayers from the costs around the rapid build-out and construction of infrastructure to support businesses such as data centers".
- AEP Ohio's tariff took effect July 23, 2025, and the settlement set out a process to end its moratorium on new Central Ohio data center agreements. Customers above 75,000 kW pay a minimum demand of 57,500 kW plus 100% of capacity above 75,000 kW, capped at 85% of contract capacity.
- For Georgia Power customers, the PSC approved on July 1, 2025 a plan that keeps base rates unchanged through at least the end of 2028, excluding fuel and storm costs. The agreement included provisions "to ensure new large-load customers (such as data centers) cover their costs appropriately".
What the Data Shows About Data Centers and Prices
The clearest measured link runs through PJM's capacity market. PJM attributes nearly all of the 2027/28 forecast increase to data centers, and its market monitor attributes $29.4 billion of capacity charges across four auctions to data center load, or 46.2% of the total. State regulators in New Jersey and Maryland have tied the resulting bill increases to those capacity costs, and PJM-area prices rose faster than the national average in the first seven months of 2026.
Statewide price data tell a less direct story. From 2019 to 2025, four of the six data-center-heavy states saw smaller residential increases than the nation, and the fastest-rising states all lost commercial sales. LBNL and Brattle tied that pattern to fixed costs being spread over more sales, and warned it may not hold where supply is constrained.
Regulators in Virginia, Ohio, and Georgia have answered with minimum-payment rules and long contracts for the largest customers. None of the sources we reviewed has yet published a measured bill effect from them.
So if you are judging how much data centers raise your electricity price, the best published evidence is the IMM's capacity analysis for PJM customers, and outside PJM the state data do not yet isolate a data center effect.
Methodology
Scope. We compiled US retail electricity prices by state for 2019 to 2025 and January to July 2026, PJM capacity auction results for the 2024/25 to 2028/29 delivery years, the market monitor's data center impact estimates, published residential bill impacts, and large-load tariff decisions for Dominion, AEP Ohio, and Georgia Power. The six data-center-heavy states are Virginia, Texas, Ohio, Georgia, Arizona, and Oregon, where large data center clusters have formed. All amounts are in US dollars.
Prices. Retail prices are nominal and not adjusted for inflation. Annual prices are EIA-861 total electric industry averages, which divide revenue by sales and include all retail providers. January to July figures are EIA's preliminary monthly estimates. The District of Columbia is ranked alongside the 50 states.
Calculations. Percentage changes, ranks, cleared capacity times price, and the 2024/25 to 2025/26 auction price multiple are our calculations from the published figures. Cleared capacity times price does not equal total cost to load, because load hedged through self-supply or bilateral contracts does not pay the clearing price. Capacity auction prices are RTO resource clearing prices in $/MW-day of unforced capacity.
Attribution. We report a figure as caused by data centers only where the source says so. The IMM estimates are counterfactual model results from Monitoring Analytics, not metered costs. The Dominion bill increase covers all drivers of the rate case. The New Jersey increases reflect a full supply auction result, which the Board said was driven mainly by capacity costs. We did not link state price changes in the two state price tables to data centers.
Notes on specific figures. The IMM's July 2026 presentation reports the 2028/29 impact rounded to $6.3 billion. PJM's 2027/28 report gives the reliability shortfall as 6,516.6 MW in one passage and 6,623.2 MW in another, on different bases; we use 6,623 MW, the figure in PJM's release. GS-5 terms come from the Virginia SCC's release on its order. The 2023 and 2028 LBNL data center figures come from the Department of Energy's release on the report. We used EIA's downloadable files and published tables for all EIA series.
Sources
- AI Industry Reviews analysis of US electricity prices and data center capacity costs, from EIA Form EIA-861 annual data and Electric Power Monthly tables, PJM Base Residual Auction reports, Monitoring Analytics reports, state utility commission and consumer advocate releases, and LBNL and DOE publications, 2019 to 2026 data, conducted November 2026.
- US Energy Information Administration, "Annual sales to ultimate customers by state and sector, 2010 to 2025" (Form EIA-861), final 2025 data released Oct 7, 2026. eia.gov
- US Energy Information Administration, Electric Power Monthly, Table 5.6.B, "Average Price of Electricity to Ultimate Customers by End-Use Sector, by State, Year-to-Date through July 2026 and 2025," Sep 24, 2026. eia.gov
- US Energy Information Administration, "Commercial electricity sales have soared in Virginia, driven by data centers," Today in Energy, May 5, 2026. eia.gov
- US Energy Information Administration, "Commercial electricity demand grew fastest in states with rapid computing facility growth," Today in Energy, Jan 2, 2025. eia.gov
- US Department of Energy, "DOE Releases New Report Evaluating Increase in Electricity Demand from Data Centers," Dec 20, 2024. energy.gov
- Lawrence Berkeley National Laboratory and The Brattle Group, "Recent Retail Electricity Price Trends: What Do We Know... or Think We Know?" Oct 2025. lbl.gov
- PJM Interconnection, "2025/2026 Base Residual Auction Report," Jul 30, 2024. pjm.com
- PJM Interconnection, "PJM Auction Procures 134,311 MW of Generation Resources; Supply Responds to Price Signal," Jul 22, 2025. pjm.com
- PJM Interconnection, "2027/2028 Base Residual Auction Report," Dec 17, 2025. pjm.com
- PJM Interconnection, "PJM Auction Procures 134,479 MW of Generation Resources," Dec 17, 2025. pjm.com
- PJM Interconnection, "2028/2029 Base Residual Auction Report," Jul 14, 2026. pjm.com
- Monitoring Analytics, "Analysis of the 2027/2028 RPM Base Residual Auction - Part A," Jan 5, 2026. monitoringanalytics.com
- Monitoring Analytics, "Market Monitor Report," PJM Members Committee, Jul 28, 2026. monitoringanalytics.com
- PJM Interconnection, "Territory Served." pjm.com
- PJM Interconnection, "2026/2027 Base Residual Auction Report," Jul 22, 2025. pjm.com
- New Jersey Board of Public Utilities, "NJBPU Announces Conclusion of New Jersey's Annual Electricity Supply Auction," Feb 12, 2025. nj.gov
- Maryland Office of People's Counsel, "A Consumer's Guide To Summer 2025 Electric Rates," corrected Jun 12, 2025. opc.maryland.gov
- Maryland Public Service Commission, "Maryland PSC Issues Orders to Mitigate Rate Increases for BGE and Delmarva Power Customers," May 30, 2025. psc.maryland.gov
- Virginia State Corporation Commission, "In Biennial Review Ruling, SCC Creates New Class for Large-Scale Energy Users," Case PUR-2025-00058, Nov 25, 2025. scc.virginia.gov
- AEP Ohio, "AEP Ohio Proposal on Data Centers to Protect Ohio Consumers Adopted by PUCO," Jul 9, 2025. aepohio.com
- AEP Ohio, "Data Center Tariff." aepohio.com
- Georgia Public Service Commission, "PSC Approves Rule to Allow New Power Usage Terms for Data Centers," Jan 23, 2025. psc.ga.gov
- Georgia Public Service Commission, "PSC and Georgia Power Agreement: Three Year Freeze of Base Rates," May 19, 2025. psc.ga.gov
- Georgia Power, "Georgia PSC approves plan to freeze Georgia Power base rates through at least 2028," Jul 1, 2025. georgiapower.com