
Home / Research / AI SaaS Valuation Multiples 2026
Market research · October 26, 2026
AI SaaS Valuation Multiples 2026
 By Darin ten Bruggencate, Founder, AI Industry Reviews
Key Findings
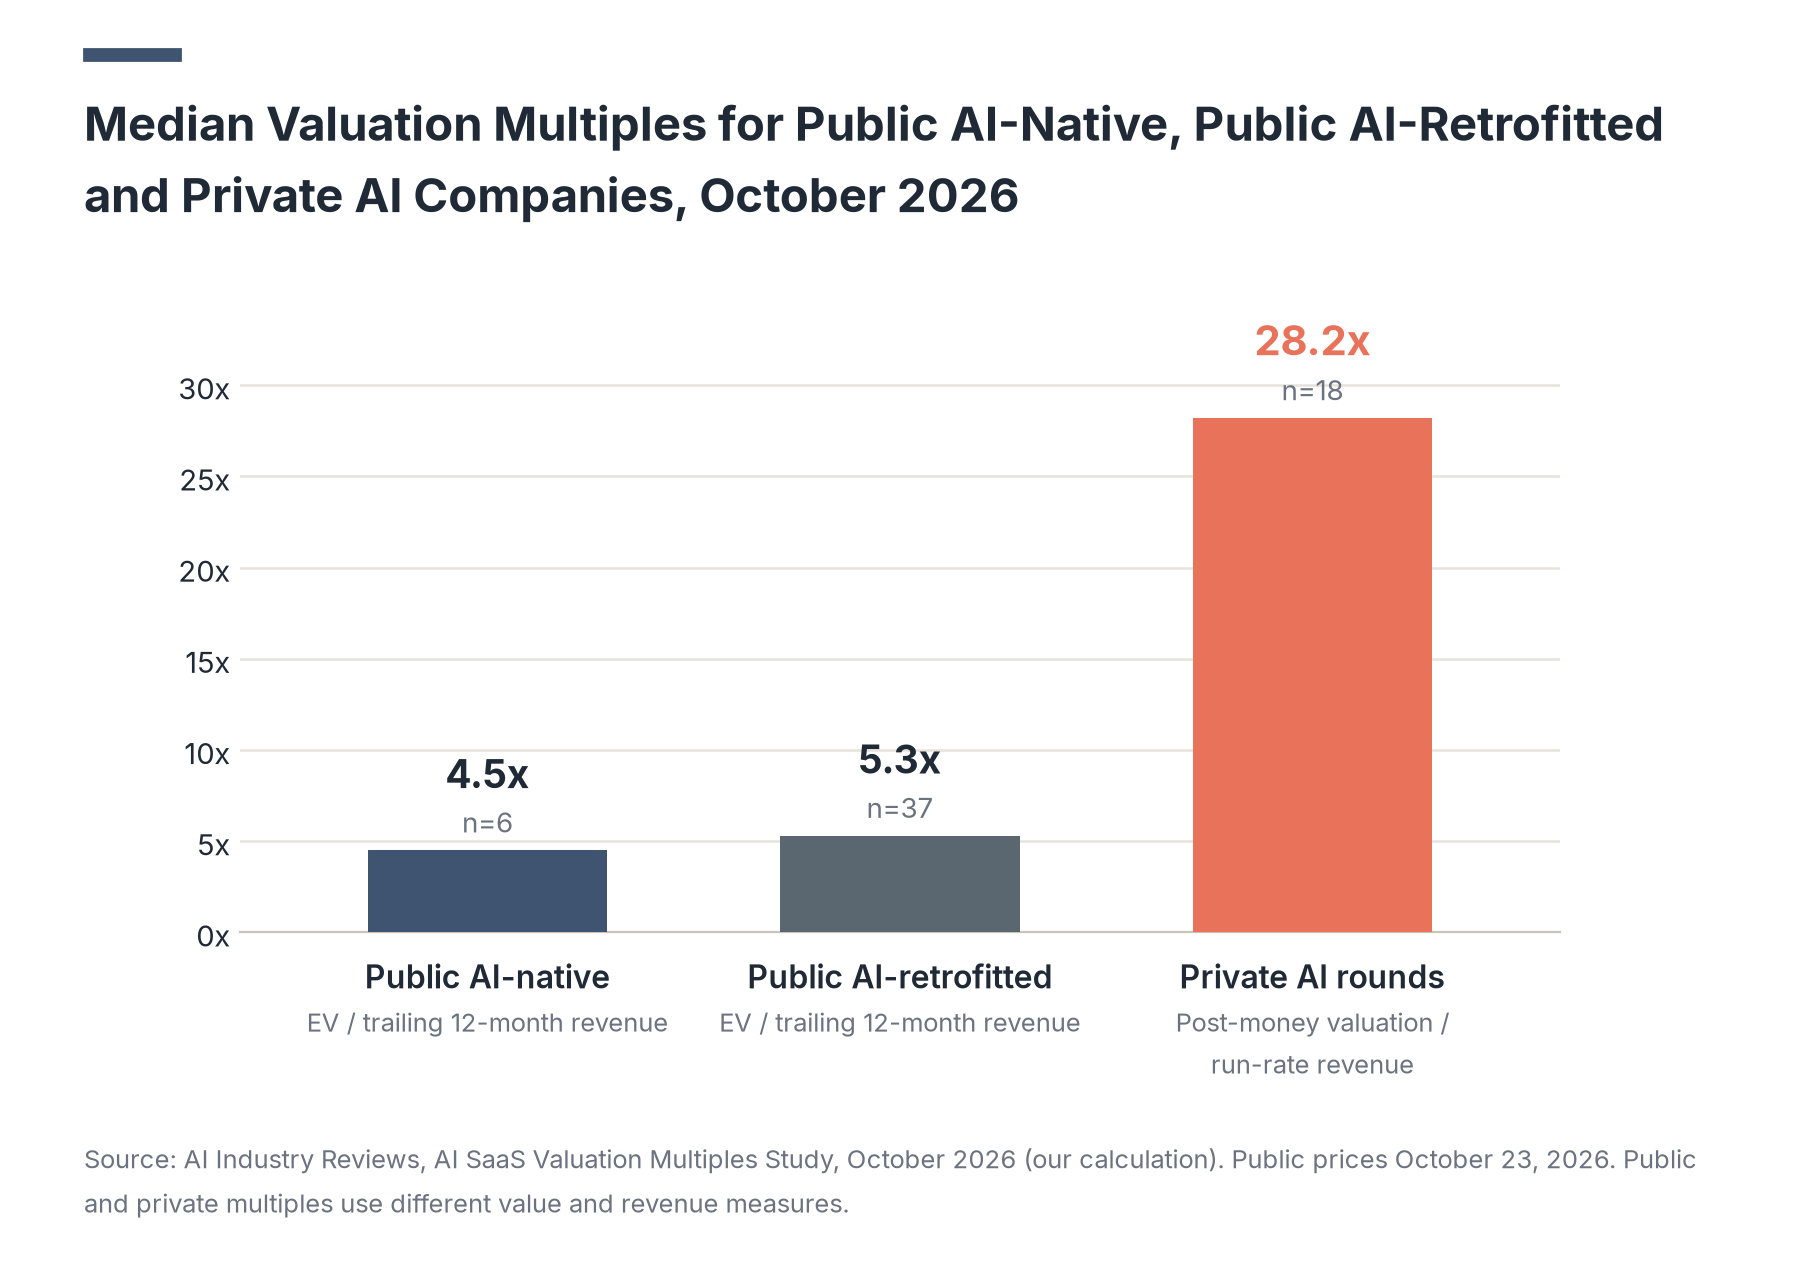
- Six publicly traded AI-native software companies had a median enterprise value of 4.5 times trailing revenue on October 23, 2026, compared with 5.3 times for 37 companies that added AI to existing products (our calculation).
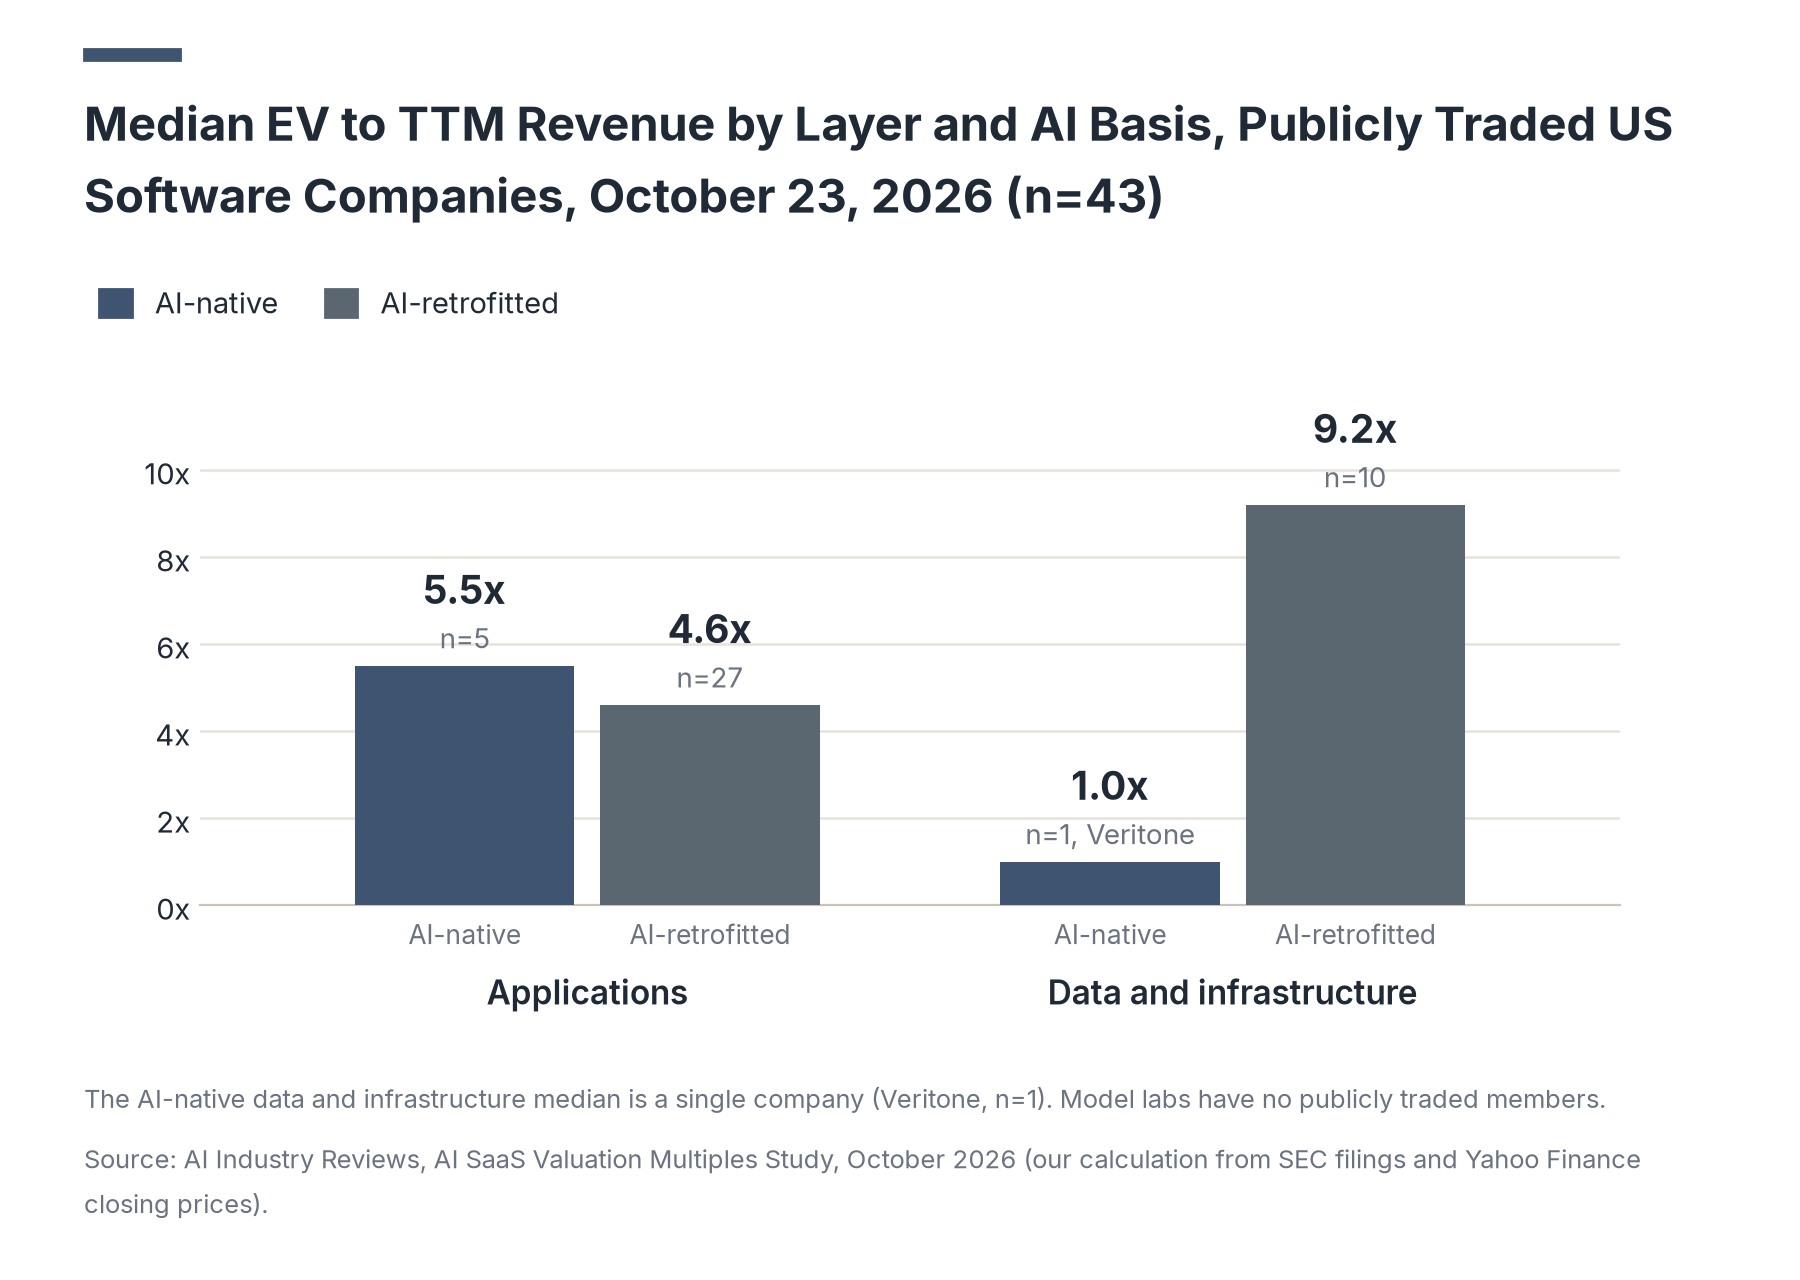
- Publicly traded data and infrastructure software companies had a median multiple of 8.4 times trailing revenue on October 23, 2026, compared with 4.7 times for application software companies (our calculation, n=43).
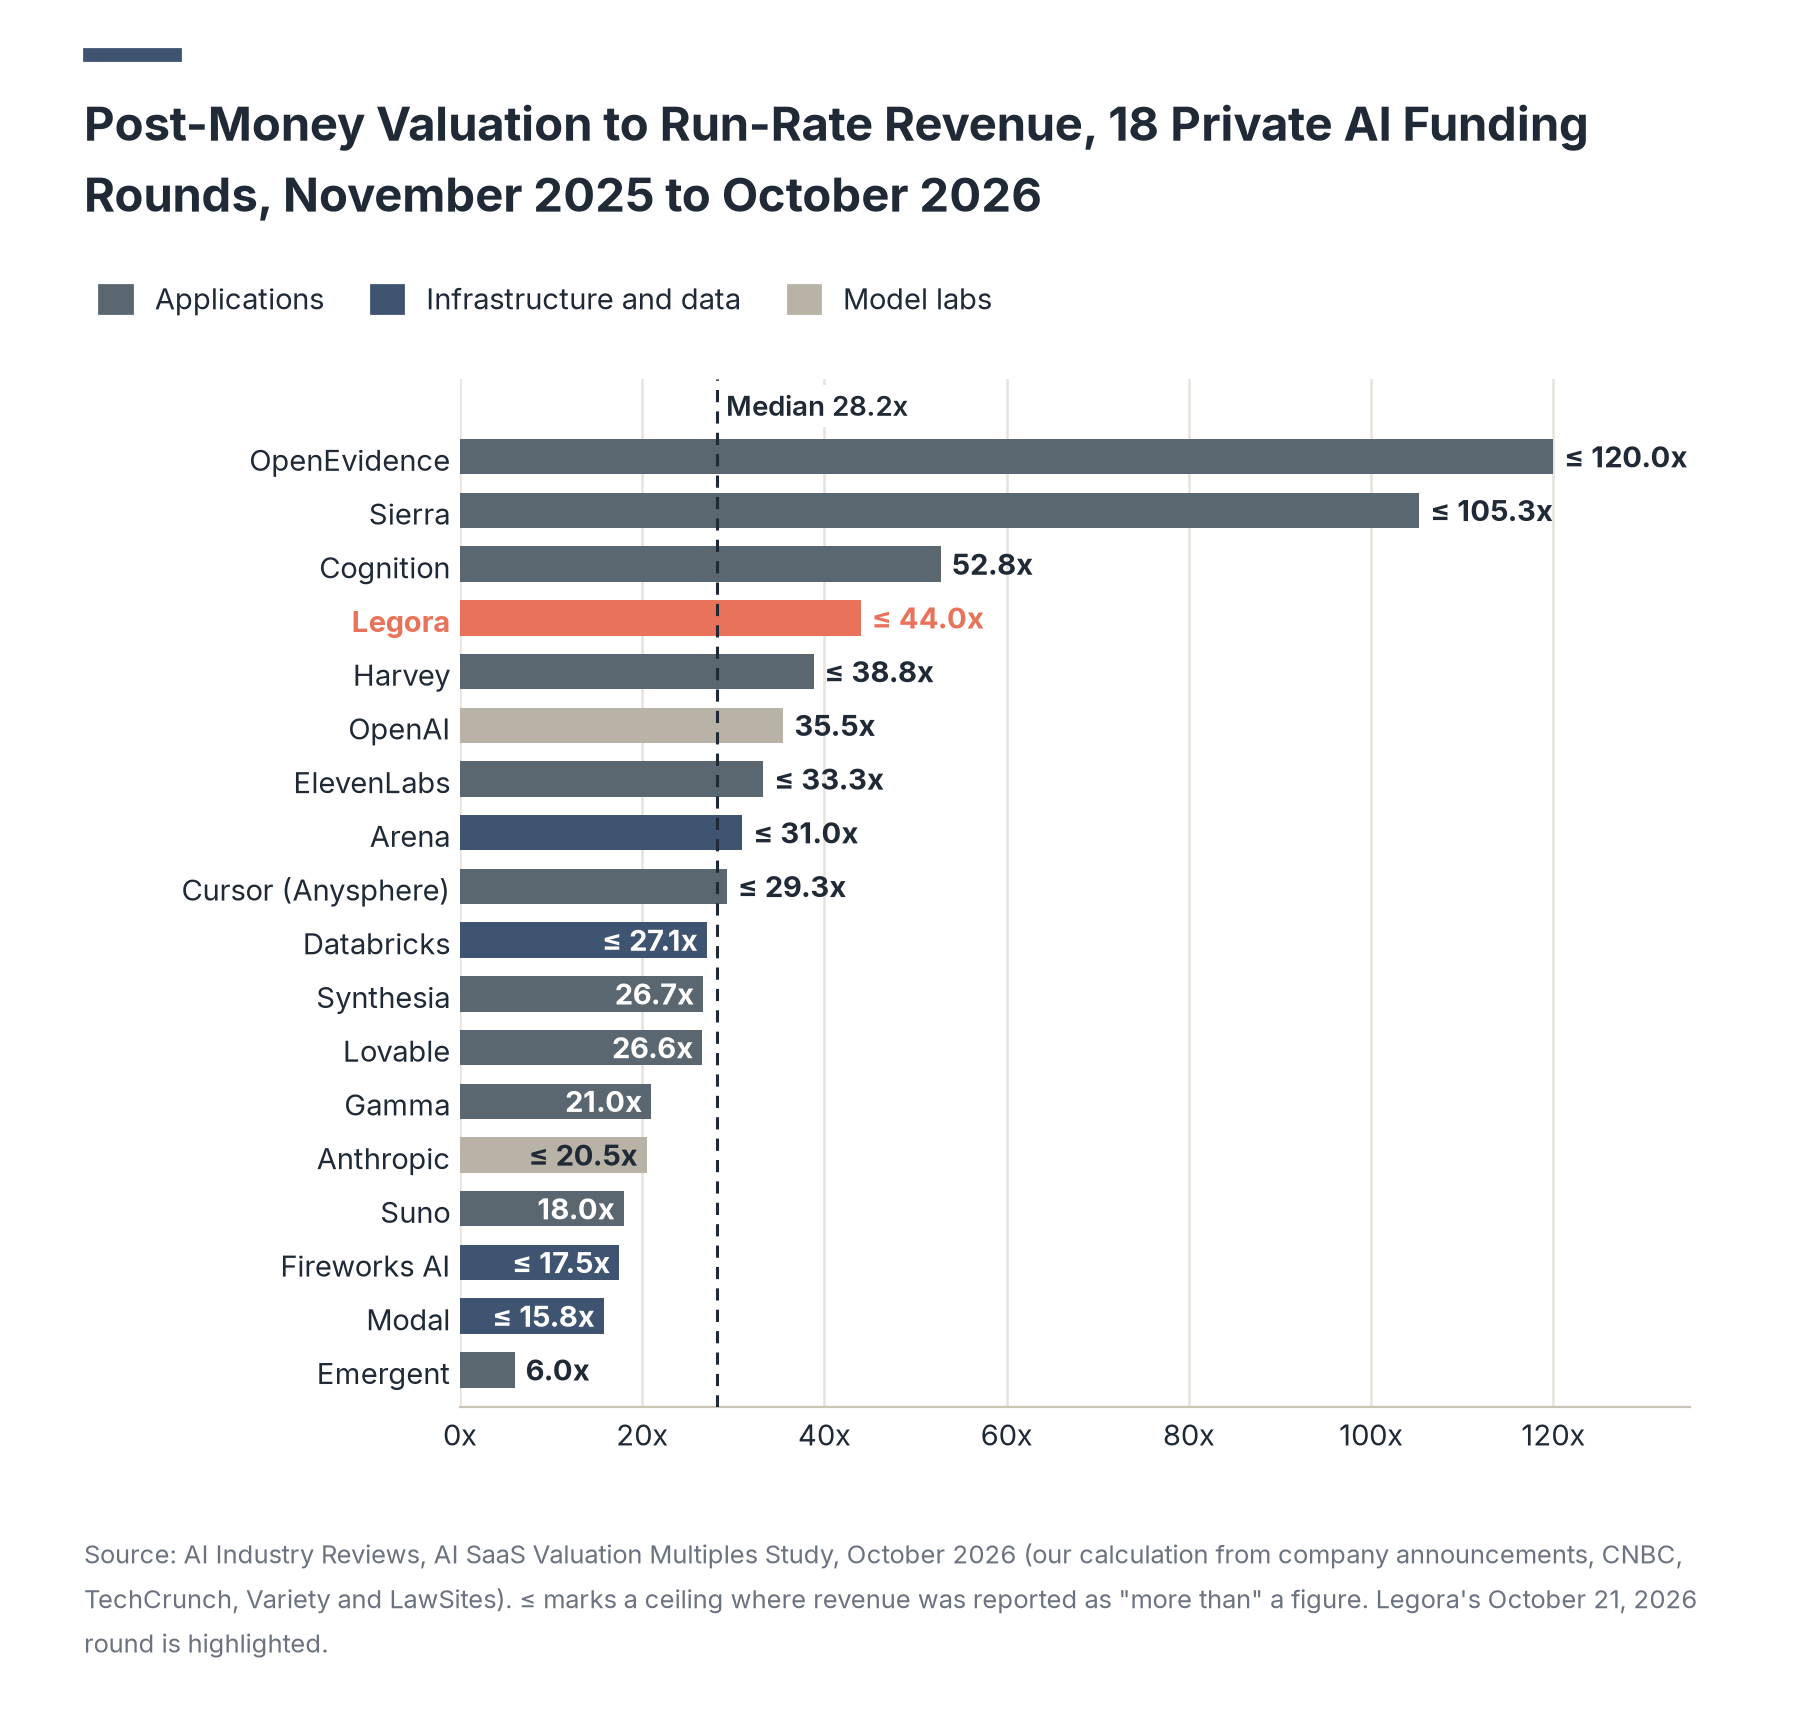
- Across 18 private AI funding rounds from November 2025 to October 2026, the median post-money valuation was 28.2 times the run-rate revenue reported near each round (our calculation).
- Bending Spoons agreed in 2026 to buy Airtable at 2.7 times annual recurring revenue and Miro at 2.3 times, based on the enterprise values and revenue the buyer disclosed (our calculation).
On October 21, 2026, legal AI company Legora raised a $550 million Series E at an $8.8 billion post-money valuation and said its annual recurring revenue had passed $200 million. With annual recurring revenue above $200 million, the round valued Legora at no more than 44 times run-rate revenue (our calculation). We measured how private AI round prices compare with the prices of publicly traded software companies, and whether companies built on AI trade at different multiples from software companies that added AI to products they already sold.
Our analysts compiled data on 43 software companies publicly traded in the US, 18 private AI funding rounds closed from November 2025 to October 2026, and 4 software acquisitions announced in 2026. For each public company, we built enterprise value from SEC filings and October 23, 2026 closing prices and divided it by trailing 12-month revenue. For each private round, we divided the post-money valuation by the run-rate revenue that the company or a news outlet reported at or near the round. We tagged every company as AI-native or AI-retrofitted and assigned it to one of three layers: model labs, infrastructure and data, or applications.
In the following sections, we compare public multiples for AI-native and AI-retrofitted companies, break the public set down by layer, revenue band and growth rate, list the multiple for each public company, set out the private round ledger by layer and revenue band, review the 2026 acquisitions with disclosed revenue, and check our figures against two published software valuation datasets.
How We Grouped Public AI Software Companies
This section sets out how the 43 public companies split by AI basis and layer, and how much revenue each group brings to the dataset. AI-native companies sold AI as their core product from founding or from a rebrand that preceded their IPO, and AI-retrofitted companies added AI features to a software business that already had customers.
Table 1. Public software companies in the dataset by AI basis and layer, October 2026 (n=43)
| AI basis | Applications | Data and infrastructure | Model labs | Total companies | Combined TTM revenue |
|---|---|---|---|---|---|
| AI-native | 5 | 1 | 0 | 6 | $1.0B |
| AI-retrofitted | 27 | 10 | 0 | 37 | $189.5B |
| All companies | 32 | 11 | 0 | 43 | $190.5B |
Source: AI Industry Reviews, AI SaaS Valuation Multiples Study, October 2026. Counts and revenue sums are our calculations from SEC filings. TTM revenue covers the four most recent reported quarters, ending June 30 to September 30, 2026. Data: public-ai-saas-comps-2026.csv
- AI-native companies account for 0.5% of the dataset's trailing revenue (our calculation, $1.0 billion of $190.5 billion). Any public comparison of AI-native and AI-retrofitted multiples compares six small companies with a group that includes Salesforce, Adobe and Intuit.
No company whose main business is building frontier models traded on a US exchange during the study period, so the model lab layer has no public members. The six AI-native companies are C3.ai, SoundHound AI, BigBear.ai, Veritone, Cerence and Airship AI, and their trailing revenue ranges from $18 million to $310 million. Their combined enterprise value was $4.3 billion on October 23, 2026, or 0.3% of the $1.69 trillion total for all 43 companies (our calculation).
Public AI SaaS Multiples: AI-Native vs AI-Retrofitted
This section compares enterprise value to trailing 12-month revenue for the AI-native and AI-retrofitted groups, with and without Palantir, and within the applications layer, where both groups have more than one member.
Table 2. EV to TTM revenue by AI basis, publicly traded US software companies, October 23, 2026 (n=43)
| Group | Companies | Median EV/TTM revenue | Middle half (25th to 75th percentile) | Mean | Aggregate EV/revenue | Median TTM revenue growth |
|---|---|---|---|---|---|---|
| All companies | 43 | 5.3x | 3.4x to 8.0x | 7.8x | 8.9x | 16.2% |
| AI-native | 6 | 4.5x | 1.9x to 5.5x | 4.2x | 4.3x | 13.5% |
| AI-retrofitted | 37 | 5.3x | 3.6x to 8.3x | 8.4x | 8.9x | 16.2% |
| AI-retrofitted, excluding Palantir | 36 | 5.2x | 3.6x to 7.9x | 6.5x | 6.7x | 15.9% |
| AI-native applications | 5 | 5.5x | 3.4x to 5.5x | 4.8x | 4.7x | 25.8% |
| AI-retrofitted applications | 27 | 4.6x | 3.4x to 5.9x | 5.1x | 5.6x | 15.0% |
Source: AI Industry Reviews, AI SaaS Valuation Multiples Study, October 2026. All figures are our calculations. Enterprise value uses October 23, 2026 closing prices from Yahoo Finance and share counts, cash, short-term investments and debt from each company's latest 10-Q or 10-K. Aggregate EV/revenue divides the group's combined enterprise value by its combined TTM revenue. Data: public-multiples-summary-2026.csv
- On October 23, 2026, the six AI-native companies traded at a lower median multiple than the retrofitted group, and inside the applications layer the order reverses, with AI-native companies at 5.5 times and retrofitted companies at 4.6 times.
- Palantir alone moves the retrofitted aggregate multiple from 6.7 times to 8.9 times, because its enterprise value of $462.8 billion equals 27.3% of the dataset total (our calculation).
- The AI-native and AI-retrofitted medians differ by 0.8 turns of revenue, compared with a 3.7-turn gap between the two layer medians in Table 3 (our calculation).
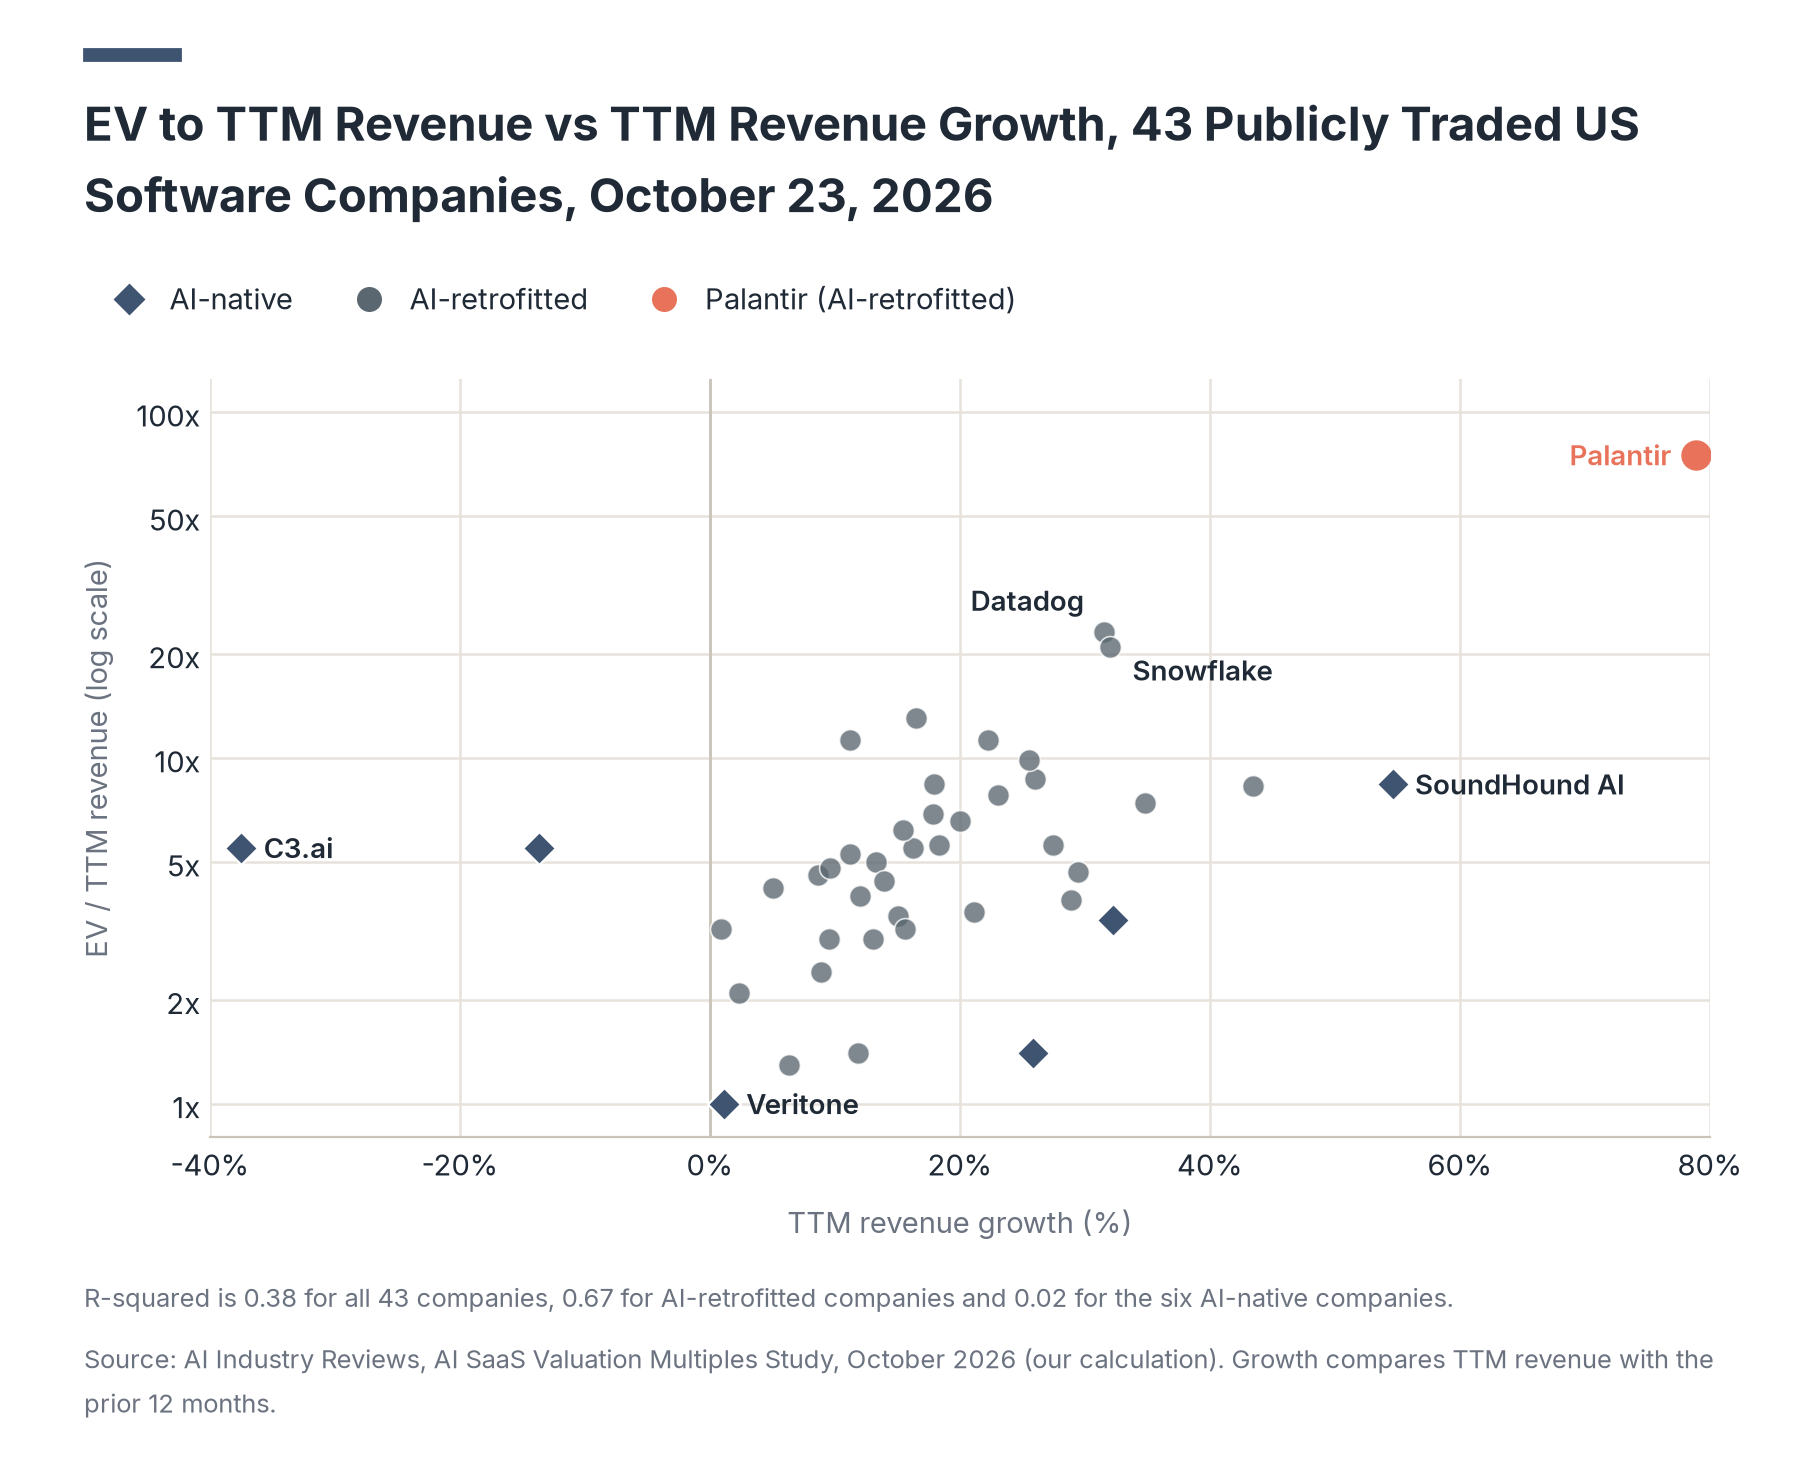
Two of the six AI-native companies, C3.ai and BigBear.ai, reported lower trailing revenue than in the prior 12 months, at 37.5% and 13.7% declines, and both traded at 5.5 times revenue. SoundHound AI grew 54.6% and traded at 8.4 times, the highest multiple in the AI-native group.
Valuation Multiples by Software Layer
This section compares the applications layer with the data and infrastructure layer, the companies that sell databases, observability, developer platforms, identity and communications services on which AI applications run.
Table 3. EV to TTM revenue by software layer, publicly traded US software companies, October 23, 2026 (n=43)
| Layer | Companies | Median EV/TTM revenue | Middle half (25th to 75th percentile) | Mean | Aggregate EV/revenue | Median TTM revenue growth |
|---|---|---|---|---|---|---|
| Applications | 32 | 4.7x | 3.4x to 5.8x | 5.1x | 5.6x | 15.2% |
| Data and infrastructure | 11 | 8.4x | 6.2x to 16.1x | 15.7x | 24.8x | 17.9% |
| Data and infrastructure, excluding Palantir | 10 | 8.1x | 5.8x to 11.0x | 9.7x | 13.0x | 17.9% |
| Data and infrastructure, AI-retrofitted only | 10 | 9.2x | 7.1x to 18.5x | 17.1x | 24.8x | 20.4% |
| Data and infrastructure, AI-native only (Veritone) | 1 | 1.0x | n/a | 1.0x | 1.0x | 1.1% |
| Model labs | 0 | n/a | n/a | n/a | n/a | n/a |
Source: AI Industry Reviews, AI SaaS Valuation Multiples Study, October 2026. All figures are our calculations. Data: public-multiples-summary-2026.csv
- The data and infrastructure median is 1.8 times the applications median (our calculation, 8.4 divided by 4.7), and the gap holds at 8.1 times when Palantir is removed.
- Six of the 10 highest multiples in Table 6 belong to data and infrastructure companies, a layer that holds 11 of the 43 companies in the dataset (our count).
Datadog at 23.2 times and Snowflake at 20.9 times rank second and third in the full dataset behind Palantir, and both grew more than 31% in their latest 12 months. Five of the 11 data and infrastructure companies traded above 9 times revenue, compared with 2 of 32 application companies, Veeva Systems and ServiceNow (our count).
Valuation Multiples by Revenue Band
This section groups the public companies by trailing 12-month revenue and records how many AI-native companies fall into each band.
Table 4. EV to TTM revenue by TTM revenue band, publicly traded US software companies, October 23, 2026 (n=43)
| TTM revenue band | Companies | AI-native companies | Median EV/TTM revenue | Middle half (25th to 75th percentile) | Median TTM revenue growth |
|---|---|---|---|---|---|
| Under $500M | 9 | 6 | 3.4x | 1.4x to 5.5x | 11.8% |
| $500M to $2B | 17 | 0 | 4.7x | 3.2x to 6.2x | 15.6% |
| $2B to $10B | 12 | 0 | 9.3x | 6.3x to 15.0x | 19.5% |
| $10B and above | 5 | 0 | 5.0x | 4.4x to 5.3x | 13.3% |
Source: AI Industry Reviews, AI SaaS Valuation Multiples Study, October 2026. All figures are our calculations. Data: public-multiples-summary-2026.csv
- Every public AI-native company in the dataset reports less than $500 million in trailing revenue, so the AI-native median is a small-company median.
- In the under-$500 million band, the six AI-native companies had a median of 4.5 times and the three retrofitted companies, Amplitude, PagerDuty and Sprout Social, had a median of 2.1 times (our calculation), so the AI-native group traded above retrofitted companies of similar size.
The $2 billion to $10 billion band holds 7 of the 11 data and infrastructure companies, including Palantir, Datadog, Snowflake and MongoDB, and has the highest median at 9.3 times. The five companies with more than $10 billion in revenue, Salesforce, ServiceNow, Adobe, Workday and Intuit, traded from 4.0 times (Adobe) to 11.3 times (ServiceNow), with a median of 5.0 times.
Revenue Growth and Valuation Multiples
This section groups the public companies by trailing revenue growth and measures how much of the difference in multiples growth accounts for, using a straight-line fit of multiple on growth.
Table 5. EV to TTM revenue by TTM revenue growth band, publicly traded US software companies, October 23, 2026 (n=43)
| TTM revenue growth | Companies | AI-native companies | Median EV/TTM revenue | Middle half (25th to 75th percentile) | Aggregate EV/revenue |
|---|---|---|---|---|---|
| Under 10% | 11 | 3 | 3.2x | 2.2x to 4.7x | 3.8x |
| 10% to 19.9% | 15 | 0 | 5.3x | 3.8x to 6.6x | 5.3x |
| 20% to 29.9% | 10 | 1 | 6.1x | 4.1x to 8.5x | 8.9x |
| 30% and above | 7 | 2 | 8.4x | 7.8x to 22.0x | 38.4x |
Source: AI Industry Reviews, AI SaaS Valuation Multiples Study, October 2026. All figures are our calculations. Growth compares TTM revenue with revenue in the prior 12 months. Data: public-multiples-summary-2026.csv, public-growth-regression-2026.csv
- The median multiple rises in each growth band, from 3.2 times for companies growing less than 10% to 8.4 times for companies growing 30% or more.
- Growth accounted for 67% of the variation in multiples among AI-retrofitted companies (R-squared 0.67, n=37) and 30% once Palantir is removed (n=36), compared with an R-squared of 0.02 among the six AI-native companies (our calculation).
- Among the six AI-native companies, multiples range from 1.0 to 8.4 times across growth rates from a 37.5% decline to a 54.6% increase.
Across all 43 companies, each additional percentage point of growth was associated with 0.40 more turns of revenue (R-squared 0.38). Without Palantir, which grew 78.9% and traded at 75.2 times, the slope falls to 0.11 turns per point and the R-squared to 0.13 (our calculation, n=42). The two AI-native companies in the top growth band are SoundHound AI at 8.4 times and Airship AI at 3.4 times.
Public AI SaaS Valuation Multiples by Company
This section lists the multiple, growth rate and classification for each of the 43 public companies, sorted from the highest multiple to the lowest.
Table 6. EV to TTM revenue by company, publicly traded US software companies, October 23, 2026 (n=43)
| Company (ticker) | AI basis | Layer | TTM revenue ($M) | TTM revenue growth | Enterprise value ($B) | EV/TTM revenue |
|---|---|---|---|---|---|---|
| Palantir (PLTR) | AI-retrofitted | Data and infrastructure | 6,156 | 78.9% | 462.8 | 75.2x |
| Datadog (DDOG) | AI-retrofitted | Data and infrastructure | 3,967 | 31.5% | 92.1 | 23.2x |
| Snowflake (SNOW) | AI-retrofitted | Data and infrastructure | 5,435 | 32.0% | 113.6 | 20.9x |
| Veeva Systems (VEEV) | AI-retrofitted | Applications | 3,458 | 16.5% | 45.2 | 13.1x |
| ServiceNow (NOW) | AI-retrofitted | Applications | 14,732 | 22.2% | 166.8 | 11.3x |
| Okta (OKTA) | AI-retrofitted | Data and infrastructure | 3,073 | 11.2% | 34.8 | 11.3x |
| MongoDB (MDB) | AI-retrofitted | Data and infrastructure | 2,783 | 25.5% | 27.5 | 9.9x |
| Atlassian (TEAM) | AI-retrofitted | Applications | 6,572 | 26.0% | 57.4 | 8.7x |
| SoundHound AI (SOUN) | AI-native | Applications | 203 | 54.6% | 1.7 | 8.4x |
| Dynatrace (DT) | AI-retrofitted | Data and infrastructure | 2,096 | 17.9% | 17.6 | 8.4x |
| Figma (FIG) | AI-retrofitted | Applications | 1,282 | 43.4% | 10.6 | 8.3x |
| GitLab (GTLB) | AI-retrofitted | Data and infrastructure | 1,055 | 23.0% | 8.2 | 7.8x |
| Navan (NAVN) | AI-retrofitted | Applications | 826 | 34.8% | 6.1 | 7.4x |
| Twilio (TWLO) | AI-retrofitted | Data and infrastructure | 5,572 | 17.8% | 38.3 | 6.9x |
| AppFolio (APPF) | AI-retrofitted | Applications | 1,087 | 20.0% | 7.2 | 6.6x |
| Procore (PCOR) | AI-retrofitted | Applications | 1,422 | 15.4% | 8.9 | 6.2x |
| Amplitude (AMPL) | AI-retrofitted | Applications | 374 | 18.3% | 2.1 | 5.6x |
| Braze (BRZE) | AI-retrofitted | Applications | 834 | 27.4% | 4.7 | 5.6x |
| C3.ai (AI) | AI-native | Applications | 232 | -37.5% | 1.3 | 5.5x |
| BigBear.ai (BBAI) | AI-native | Applications | 132 | -13.7% | 0.7 | 5.5x |
| Elastic (ESTC) | AI-retrofitted | Data and infrastructure | 1,802 | 16.2% | 9.8 | 5.5x |
| Salesforce (CRM) | AI-retrofitted | Applications | 43,938 | 11.2% | 231.7 | 5.3x |
| Workday (WDAY) | AI-retrofitted | Applications | 10,155 | 13.3% | 51.1 | 5.0x |
| Box (BOX) | AI-retrofitted | Applications | 1,234 | 9.6% | 5.9 | 4.8x |
| Duolingo (DUOL) | AI-retrofitted | Applications | 1,145 | 29.4% | 5.4 | 4.7x |
| Docusign (DOCU) | AI-retrofitted | Applications | 3,361 | 8.6% | 15.5 | 4.6x |
| Intuit (INTU) | AI-retrofitted | Applications | 21,448 | 13.9% | 95.2 | 4.4x |
| Zoom (ZM) | AI-retrofitted | Applications | 4,993 | 5.0% | 20.8 | 4.2x |
| Adobe (ADBE) | AI-retrofitted | Applications | 25,970 | 12.0% | 103.3 | 4.0x |
| Klaviyo (KVYO) | AI-retrofitted | Applications | 1,390 | 28.9% | 5.4 | 3.9x |
| HubSpot (HUBS) | AI-retrofitted | Applications | 3,449 | 21.1% | 12.4 | 3.6x |
| UiPath (PATH) | AI-retrofitted | Applications | 1,721 | 15.0% | 6.1 | 3.5x |
| Airship AI (AISP) | AI-native | Applications | 18 | 32.2% | 0.1 | 3.4x |
| Freshworks (FRSH) | AI-retrofitted | Applications | 904 | 15.6% | 2.9 | 3.2x |
| Pegasystems (PEGA) | AI-retrofitted | Applications | 1,748 | 0.9% | 5.7 | 3.2x |
| Asana (ASAN) | AI-retrofitted | Applications | 828 | 9.5% | 2.5 | 3.0x |
| BILL Holdings (BILL) | AI-retrofitted | Applications | 1,653 | 13.0% | 4.9 | 3.0x |
| Five9 (FIVN) | AI-retrofitted | Applications | 1,204 | 8.9% | 2.9 | 2.4x |
| PagerDuty (PD) | AI-retrofitted | Data and infrastructure | 495 | 2.3% | 1.0 | 2.1x |
| Cerence (CRNC) | AI-native | Applications | 310 | 25.8% | 0.4 | 1.4x |
| Sprout Social (SPT) | AI-retrofitted | Applications | 482 | 11.8% | 0.7 | 1.4x |
| Sprinklr (CXM) | AI-retrofitted | Applications | 873 | 6.3% | 1.1 | 1.3x |
| Veritone (VERI) | AI-native | Data and infrastructure | 91 | 1.1% | 0.1 | 1.0x |
Source: AI Industry Reviews, AI SaaS Valuation Multiples Study, October 2026. All figures are our calculations from SEC 10-Q and 10-K filings and Yahoo Finance closing prices on October 23, 2026. Data: public-ai-saas-comps-2026.csv
- The top 10 includes one AI-native company, SoundHound AI, in ninth place at 8.4 times.
- A multiple based on trailing revenue rewards companies whose revenue is rising fastest now, so the order in this table changes each quarter as new results replace the oldest quarter in each company's total.
Three AI-native companies traded below the 5.3 times median for the full set, and Veritone had the lowest multiple of the 43 at 1.0 times. Among the largest AI-retrofitted companies, ServiceNow traded at 11.3 times and Salesforce at 5.3 times, while Adobe, with $26.0 billion in trailing revenue, traded at 4.0 times.
Private AI Funding Rounds and Run-Rate Multiples
This section records the latest priced primary round for 18 private AI companies from November 2025 to October 2026, with the post-money valuation, the revenue figure reported at or near the round, and the multiple between them.
Table 7. Post-money valuation to run-rate revenue, private AI funding rounds, November 2025 to October 2026 (n=18)
| Company | Layer | Round and date | Post-money valuation | Revenue as reported | Valuation/run-rate revenue |
|---|---|---|---|---|---|
| OpenEvidence | Applications | Funding round, Jan 2026 | $12B | More than $100M annualized revenue | 120.0x |
| Sierra | Applications | Series E, May 2026 | $15.8B | More than $150M ARR | 105.3x |
| Cognition | Applications | Series D, May 2026 | $26B | $492M run-rate revenue | 52.8x |
| Legora | Applications | Series E, Oct 2026 | $8.8B | More than $200M ARR | 44.0x |
| Harvey | Applications | Funding round, Sep 2026 | $15.5B | More than $400M ARR | 38.8x |
| OpenAI | Model labs | Funding round, Mar 2026 | $852B | $2B a month ($24B a year, our calculation) | 35.5x |
| ElevenLabs | Applications | Series D, Feb 2026 | $11B | More than $330M ARR at end of 2025 | 33.3x |
| Arena | Infrastructure and data | Series B, Oct 2026 | $3.1B | More than $100M annualized | 31.0x |
| Cursor (Anysphere) | Applications | Funding round, Nov 2025 | $29.3B | More than $1B annualized revenue | 29.3x |
| Databricks | Infrastructure and data | Funding round, Aug 2026 | $190B | More than $7B revenue run-rate | 27.1x |
| Synthesia | Applications | Series E, Jan 2026 | $4B | $150M ARR | 26.7x |
| Lovable | Applications | Series C, Aug 2026 | $13.3B | $500M annualized run-rate in June 2026 | 26.6x |
| Gamma | Applications | Series B, Nov 2025 | $2.1B | $100M ARR | 21.0x |
| Anthropic | Model labs | Series H, May 2026 | $965B | More than $47B run-rate revenue | 20.5x |
| Suno | Applications | Series D, Jun 2026 | $5.4B | $300M ARR in February 2026 | 18.0x |
| Fireworks AI | Infrastructure and data | Funding round, Jul 2026 | $17.5B | More than $1B annualized revenue | 17.5x |
| Modal | Infrastructure and data | Series D, Oct 2026 | $15.75B | More than $1B annualized run-rate | 15.8x |
| Emergent | Applications | Series B, Jan 2026 | $300M | $50M ARR | 6.0x |
Source: AI Industry Reviews, AI SaaS Valuation Multiples Study, October 2026, from company announcements and reporting by CNBC, TechCrunch, Variety and LawSites (sources 6 to 23). Multiples are our calculations. Where a company reported "more than" a figure, the multiple uses that figure and is a ceiling. Data: private-ai-round-ledger-2026.csv
- Eleven of the 18 rounds report revenue as "more than" a figure, so the true multiple for those companies is at or below the one shown.
- The median of 28.2 times compares with 4.5 times for public AI-native companies and 5.3 times for all 43 public companies, which means a private AI company valued at the median would need its revenue to grow more than fivefold to reach the public median multiple at the same valuation (our calculation).
OpenEvidence and Sierra are the only rounds above 100 times, and without them the median falls to 26.9 times (our calculation, n=16). Cursor raised at 29.3 times in November 2025 on more than $1 billion in annualized revenue, and Cognition raised at 52.8 times in May 2026, on a $26 billion post-money valuation and $492 million in run-rate revenue. Anthropic, the largest valuation in the ledger, had one of the lower multiples at 20.5 times.
Private AI Round Multiples by Layer and Revenue Band
This section groups the 18 private rounds by layer and by the size of the run-rate revenue reported near each round.
Table 8. Median post-money valuation to run-rate revenue by layer and run-rate band, private AI funding rounds, November 2025 to October 2026 (n=18)
| Group | Rounds | Median valuation/run-rate revenue | Lowest | Highest |
|---|---|---|---|---|
| All rounds | 18 | 28.2x | 6.0x | 120.0x |
| Model labs | 2 | 28.0x | 20.5x | 35.5x |
| Infrastructure and data | 4 | 22.3x | 15.8x | 31.0x |
| Applications | 12 | 31.3x | 6.0x | 120.0x |
| Run-rate under $100M | 1 | 6.0x | 6.0x | 6.0x |
| Run-rate $100M to $499M | 10 | 36.0x | 18.0x | 120.0x |
| Run-rate $500M to $999M | 1 | 26.6x | 26.6x | 26.6x |
| Run-rate $1B to $9.9B | 4 | 22.3x | 15.8x | 29.3x |
| Run-rate $10B and above | 2 | 28.0x | 20.5x | 35.5x |
Source: AI Industry Reviews, AI SaaS Valuation Multiples Study, October 2026. All figures are our calculations. Data: private-ledger-summary-2026.csv
- Private investors priced AI applications at a higher median multiple than AI infrastructure, the reverse of the public order in Table 3, where data and infrastructure leads applications.
- The three highest application multiples, OpenEvidence at 120.0 times, Sierra at 105.3 times and Cognition at 52.8 times, came from companies reporting $100 million to $492 million in revenue at valuations from $12 billion to $26 billion.
The four infrastructure rounds, Databricks, Fireworks AI, Modal and Arena, range from 15.8 times to 31.0 times. Three of the four companies with run-rate revenue between $1 billion and $9.9 billion raised at less than 28 times (our count).
AI Software Acquisitions in 2026
This section lists software acquisitions announced in 2026 where the buyer or the target published a deal value, and divides that value by the target's reported revenue where one was available.
Table 9. Value to revenue in 2026 software acquisitions with AI products (n=4 deals)
| Buyer and target | Announced | AI basis of target | Consideration | Deal value | Target revenue as reported | Value/revenue |
|---|---|---|---|---|---|---|
| SpaceX and Cursor (Anysphere) | June 16, 2026 | AI-native | All stock | $60B | More than $4B annualized revenue, per sources cited by Forbes, June 8, 2026 | 15.0x |
| Bending Spoons and Miro | September 10, 2026 | AI-retrofitted | All cash | $1.355B enterprise value | About $600M ARR | 2.3x |
| Bending Spoons and Airtable | August 4, 2026 | AI-retrofitted | All cash | $1.285B enterprise value | About $480M ARR as of June 2026 | 2.7x |
| Salesforce and Fin (formerly Intercom) | June 15, 2026 | AI-retrofitted | Not stated | About $3.6B | Not disclosed in the announcement | n/a |
Source: AI Industry Reviews, AI SaaS Valuation Multiples Study, October 2026, from SEC filings, company announcements, CNBC and Forbes (sources 24 to 28). Value/revenue is our calculation. SpaceX disclosed no Cursor revenue figure. Data: ai-software-acquisition-multiples-2026.csv
- Cursor's sale price of $60 billion was about double its November 2025 post-money valuation of $29.3 billion, and the multiple fell from 29.3 times to 15.0 times because reported revenue grew about fourfold over the same period (our calculation).
- The two Bending Spoons deals, at 2.3 and 2.7 times, priced below the 5.3 times median for the 37 publicly traded AI-retrofitted companies, and 33 of those 37 companies traded above 2.7 times (our count).
Airtable reported revenue growth of more than 20% at the time of its sale, and Miro described its product as an AI-first workspace. Both deals are all-cash transactions with enterprise values close to $1.3 billion, and each implied an equity value above $1.7 billion once the target's net cash was added.
Benchmarks From Published Software Valuation Data
This section compares our public figures with two published software valuation datasets that use different samples, dates and revenue measures.
Table 10. Our public multiples compared with published software valuation benchmarks
| Benchmark | Publisher and date | Sample | Published multiple | Our comparable figure |
|---|---|---|---|---|
| Software (System and Application), EV/sales | Aswath Damodaran, NYU Stern, January 2026 | 309 US companies | 11.41x | 8.9x aggregate EV/TTM revenue (n=43) |
| Software (Internet), EV/sales | Aswath Damodaran, NYU Stern, January 2026 | 29 US companies | 9.56x | n/a |
| Total US market, EV/sales | Aswath Damodaran, NYU Stern, January 2026 | 5,994 US companies | 3.97x | n/a |
| Overall median EV/NTM revenue | Clouded Judgement (Jamin Ball), October 23, 2026 | Public cloud software companies | 4.8x | 5.3x median EV/TTM revenue (n=43) |
| Top five median EV/NTM revenue | Clouded Judgement (Jamin Ball), October 23, 2026 | Five highest multiples in the same set | 33.1x | 20.9x median of our five highest (n=5) |
| Median trailing revenue growth | Clouded Judgement (Jamin Ball), October 23, 2026 | Public cloud software companies | 16% | 16.2% (n=43) |
Source: Damodaran Online, Price and Value to Sales Ratios and Margins by Industry Sector (US), January 2026; Clouded Judgement, October 23, 2026. Our comparable figures come from the AI Industry Reviews, AI SaaS Valuation Multiples Study, October 2026. Data: public-multiples-summary-2026.csv
- Our median trailing revenue growth of 16.2% compares with Clouded Judgement's 16% for the same week. Our median of 5.3 times trailing revenue compares with its 4.8 times next-12-months revenue, and for a company with rising revenue, a multiple on forecast revenue comes out lower than a multiple on trailing revenue.
- Damodaran's software figure of 11.41 times covers 309 companies at January 2026 prices, nine months before our October prices, so the two aggregate figures differ in both sample and date.
Damodaran's ratio for the total US market, 3.97 times, is about a third of his figure for system and application software. Clouded Judgement measures multiples on analyst forecasts of revenue for the next 12 months, and our dataset uses reported revenue for the last 12 months, so the two medians measure different years of revenue.
What AI SaaS Valuation Multiples Mean Going Forward
Private AI valuations are set in negotiated rounds on revenue figures that each company defines for itself, and public software prices are set every trading day on revenue reported in audited filings. When a private AI company goes public or is acquired, its run-rate becomes reported trailing revenue, and its price is measured on the same basis as the public companies in our dataset.
Some software companies that added AI to existing products now report revenue from their AI products as a separate figure, as Salesforce does for Agentforce. That figure shows how much of a retrofitted company's revenue comes from AI products. We classified each company as AI-native or AI-retrofitted by whether AI was its core product from founding or from a rebrand before its IPO.
Data Collection and Methodology
Public sample. We included 43 software companies whose shares trade on a US exchange and that file 10-Q and 10-K reports with the SEC, selected to cover AI-native software companies with recurring software revenue and established software companies that have launched AI products. We excluded companies whose revenue comes mainly from hardware, chips or medical diagnostics.
AI basis. A company is AI-native when AI has been its core product from founding or from a rebrand that preceded its IPO. A company is AI-retrofitted when it built a software business first and added AI features or agents to existing products. We coded Palantir as AI-retrofitted because its Foundry and Gotham platforms predate its AI Platform, launched in 2023, and Tables 2 and 3 show results with and without Palantir.
Layer. Applications covers software sold to business or consumer users for a task or workflow. Data and infrastructure covers databases, data platforms, observability, developer platforms, identity, communications APIs and AI data platforms. Model labs covers companies whose main product is a frontier AI model.
Enterprise value. Enterprise value equals the October 23, 2026 closing price from Yahoo Finance multiplied by shares outstanding, minus cash, cash equivalents and short-term investments, plus short-term and long-term debt including convertible notes, all taken from each company's latest 10-Q or 10-K as of October 23, 2026. Shares use the basic weighted-average count from the latest quarter, or the cover-page count of all common share classes where that was more recent or the weighted count was missing. Where XBRL tags missed a balance sheet line, we read the figure from the filed balance sheet. Operating lease liabilities are excluded from debt.
Revenue and growth. TTM revenue sums the four most recent reported quarters, which end between June 30 and September 30, 2026 depending on each company's fiscal calendar. Growth compares TTM revenue with the sum of the four quarters before them. Revenue bands use TTM revenue, and growth bands use TTM growth.
Private rounds. We recorded the latest priced primary round for each AI company that closed a round from November 1, 2025 to October 23, 2026 and for which the company or a news outlet published both a post-money valuation and a revenue figure dated within about six months of the round. We excluded employee tender offers, rounds reported only as in talks, revenue estimates from third-party research firms, bookings and forecast revenue, and valuations reported only in currencies other than USD. Run-rate revenue is the figure as each company or outlet reported it, and companies define it differently. We converted OpenAI's reported $2 billion a month to $24 billion a year.
Acquisitions. We included software acquisitions announced in 2026 where the buyer published a deal value and where the target's AI products are part of the stated rationale. Value/revenue uses enterprise value where the buyer reported it, and the stated deal value otherwise.
Our calculations. Medians, means, percentiles, aggregate multiples, counts and regressions are our calculations. Aggregate multiples divide combined enterprise value by combined revenue. Percentiles use linear interpolation. R-squared values come from ordinary least squares fits of EV/TTM revenue on TTM growth in percentage points. Private multiples divide post-money valuation by run-rate revenue, and public multiples divide enterprise value by trailing revenue, so the two measure price against different revenue figures. Multiples are rounded to one decimal place.
Sources
- AI Industry Reviews, AI SaaS Valuation Multiples Study: analysis of enterprise value to trailing 12-month revenue for 43 software companies publicly traded in the US as of October 23, 2026, post-money valuation to reported run-rate revenue for 18 private AI funding rounds from November 2025 to October 2026, and value to revenue for 4 software acquisitions announced in 2026, coded by AI basis, layer, revenue band and growth band, conducted October 2026.
- US Securities and Exchange Commission, EDGAR company filings (10-Q and 10-K) and XBRL company facts for the 43 public companies
- Yahoo Finance, historical closing prices, October 23, 2026
- Aswath Damodaran, Price and Value to Sales Ratios and Margins by Industry Sector (US), January 2026
- Jamin Ball, Clouded Judgement 10.23.26, October 23, 2026
- Legora, Legora raises $550 million Series E at $8.8 billion valuation, October 21, 2026
- Anthropic, Series H announcement, May 2026
- OpenAI, Accelerating the next phase of AI, March 31, 2026 and CNBC, OpenAI funding round, March 31, 2026
- Databricks, Databricks grows 80% YoY, surpasses $7B revenue run-rate, August 2026
- CNBC, Fireworks AI valuation, July 16, 2026
- Modal, $1 billion annualized run-rate and Series D, October 14, 2026
- Arena, Series B, October 8, 2026 and TechCrunch, Arena valuation, October 8, 2026
- CNBC, Cursor funding round and valuation, November 13, 2025
- Cognition, More Devins in More Places (Series D), May 27, 2026 and TechCrunch, AI coding startup Cognition raises $1B at $25B pre-money valuation, May 27, 2026
- Lovable, Series C, August 12, 2026 and TechCrunch, Lovable confirms $13.3B valuation, August 12, 2026
- ElevenLabs, Series D, February 4, 2026
- Harvey, Harvey raises $550M at a $15.5B valuation, September 2026 and LawSites, September 2026
- CNBC, Sierra fundraise, May 4, 2026
- CNBC, OpenEvidence doubles valuation to $12 billion, January 21, 2026
- TechCrunch, Gamma hits $2.1B valuation and $100M ARR, November 10, 2025
- CNBC, Synthesia funding, January 26, 2026
- Variety, Suno raises $400 million at $5.4 billion valuation, June 2026
- TechCrunch, Emergent raises $70M at $300M valuation, January 20, 2026
- SpaceX, SEC filing on the Cursor acquisition, June 2026 and CNBC, SpaceX to acquire Cursor for $60 billion, June 16, 2026
- Forbes, Cursor hits $4 billion annualized revenue, June 8, 2026
- Bending Spoons, Exhibit 99.1, agreement to acquire Airtable, August 4, 2026
- Bending Spoons, Exhibit 99.1, agreement to acquire Miro, September 10, 2026
- Salesforce, Salesforce signs definitive agreement to acquire Fin, June 15, 2026