
Home / Research / AI Memory Shortage Price Statistics
Market research · November 2, 2026
AI Memory Shortage Price Statistics: 2026 Report
 By Darin ten Bruggencate, Founder, AI Industry Reviews
Our analysts compiled quarterly contract price changes for DRAM, NAND flash, and HBM from TrendForce's published price tables, and weekly spot prices for benchmark DRAM chips and NAND wafers from TrendForce and DRAMeXchange. We pulled Micron's revenue and margins from its SEC filings, took SK hynix and Samsung results from their earnings releases and converted them to US dollars at one fixed rate, and added US producer and consumer price indexes from the Bureau of Labor Statistics. We then matched those figures with announced price increases for PCs, tablets, graphics cards, and SSDs, and with published lead times for memory orders.
Key Findings
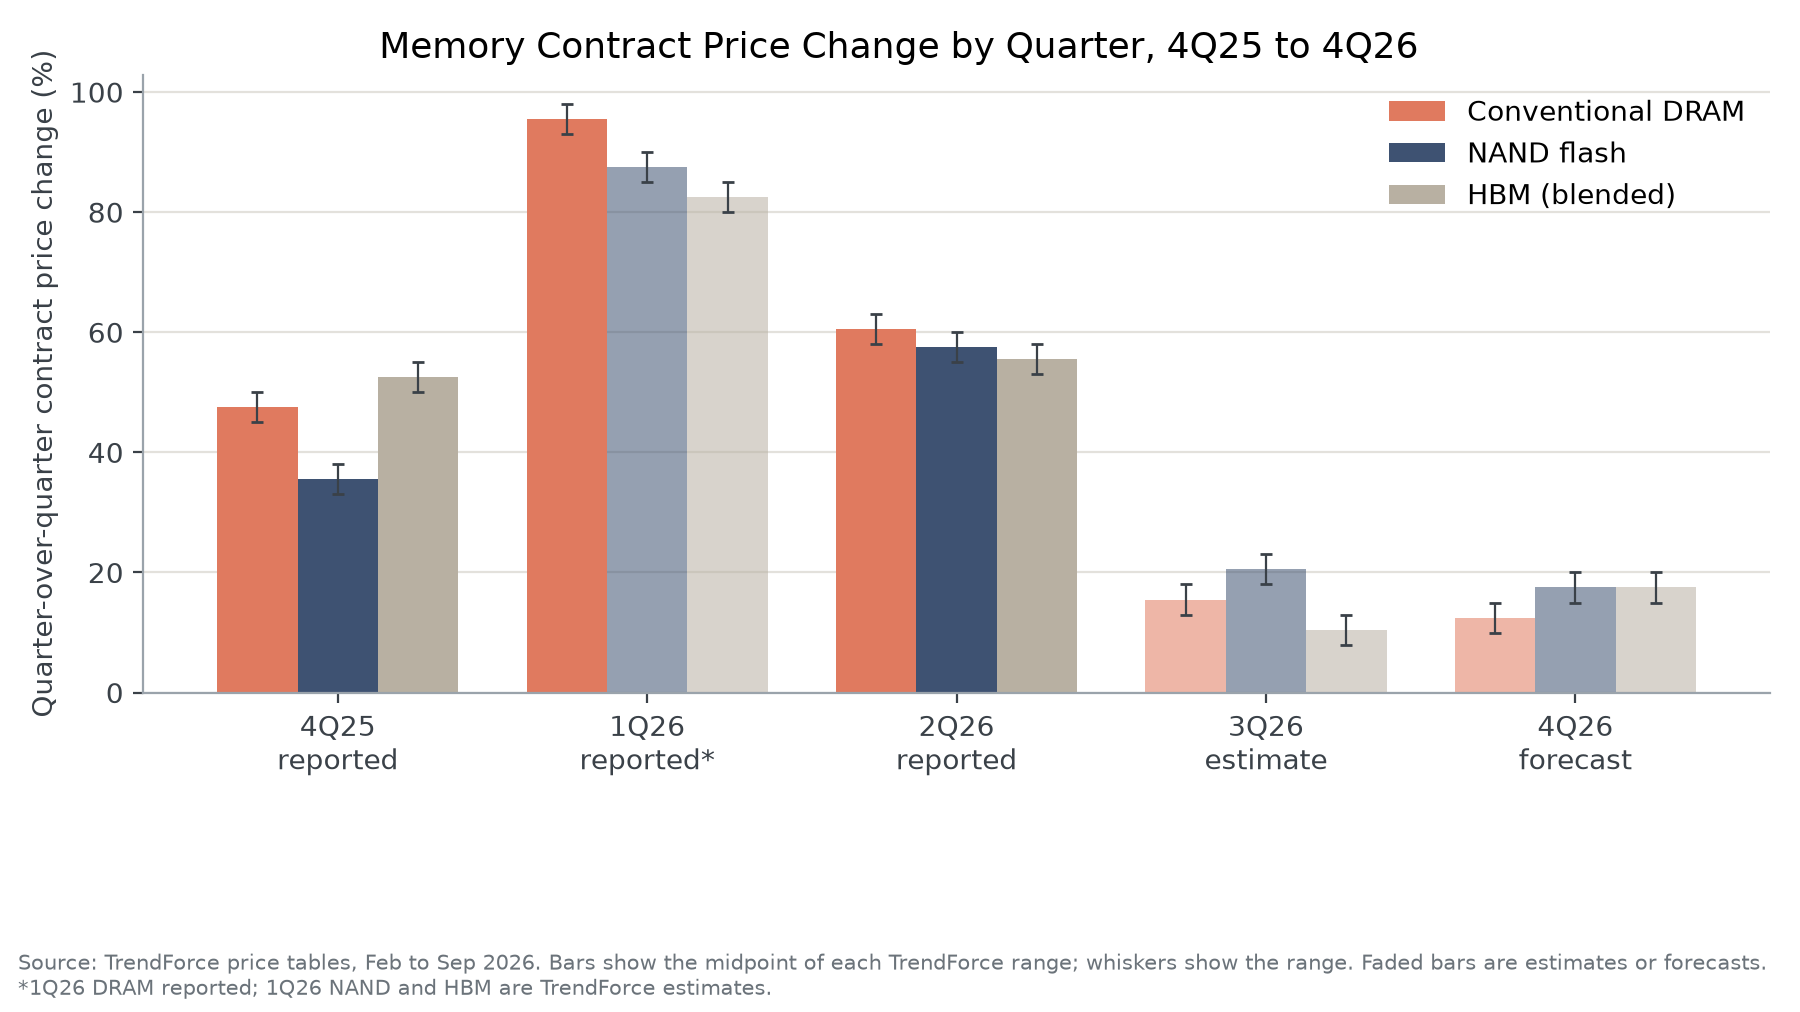
- Conventional DRAM contract prices rose 45% to 50% in the fourth quarter of 2025, 93% to 98% in the first quarter of 2026, and 58% to 63% in the second, which compounds to roughly 4.4 to 4.8 times their third-quarter 2025 level by our calculation from TrendForce ranges.
- The spot price of the DDR4 8Gb chip rose from $7.931 in October 2025 to $46.357 in October 2026, while the 512Gb NAND wafer has eased from its March peak of $22.16 to $18.59.
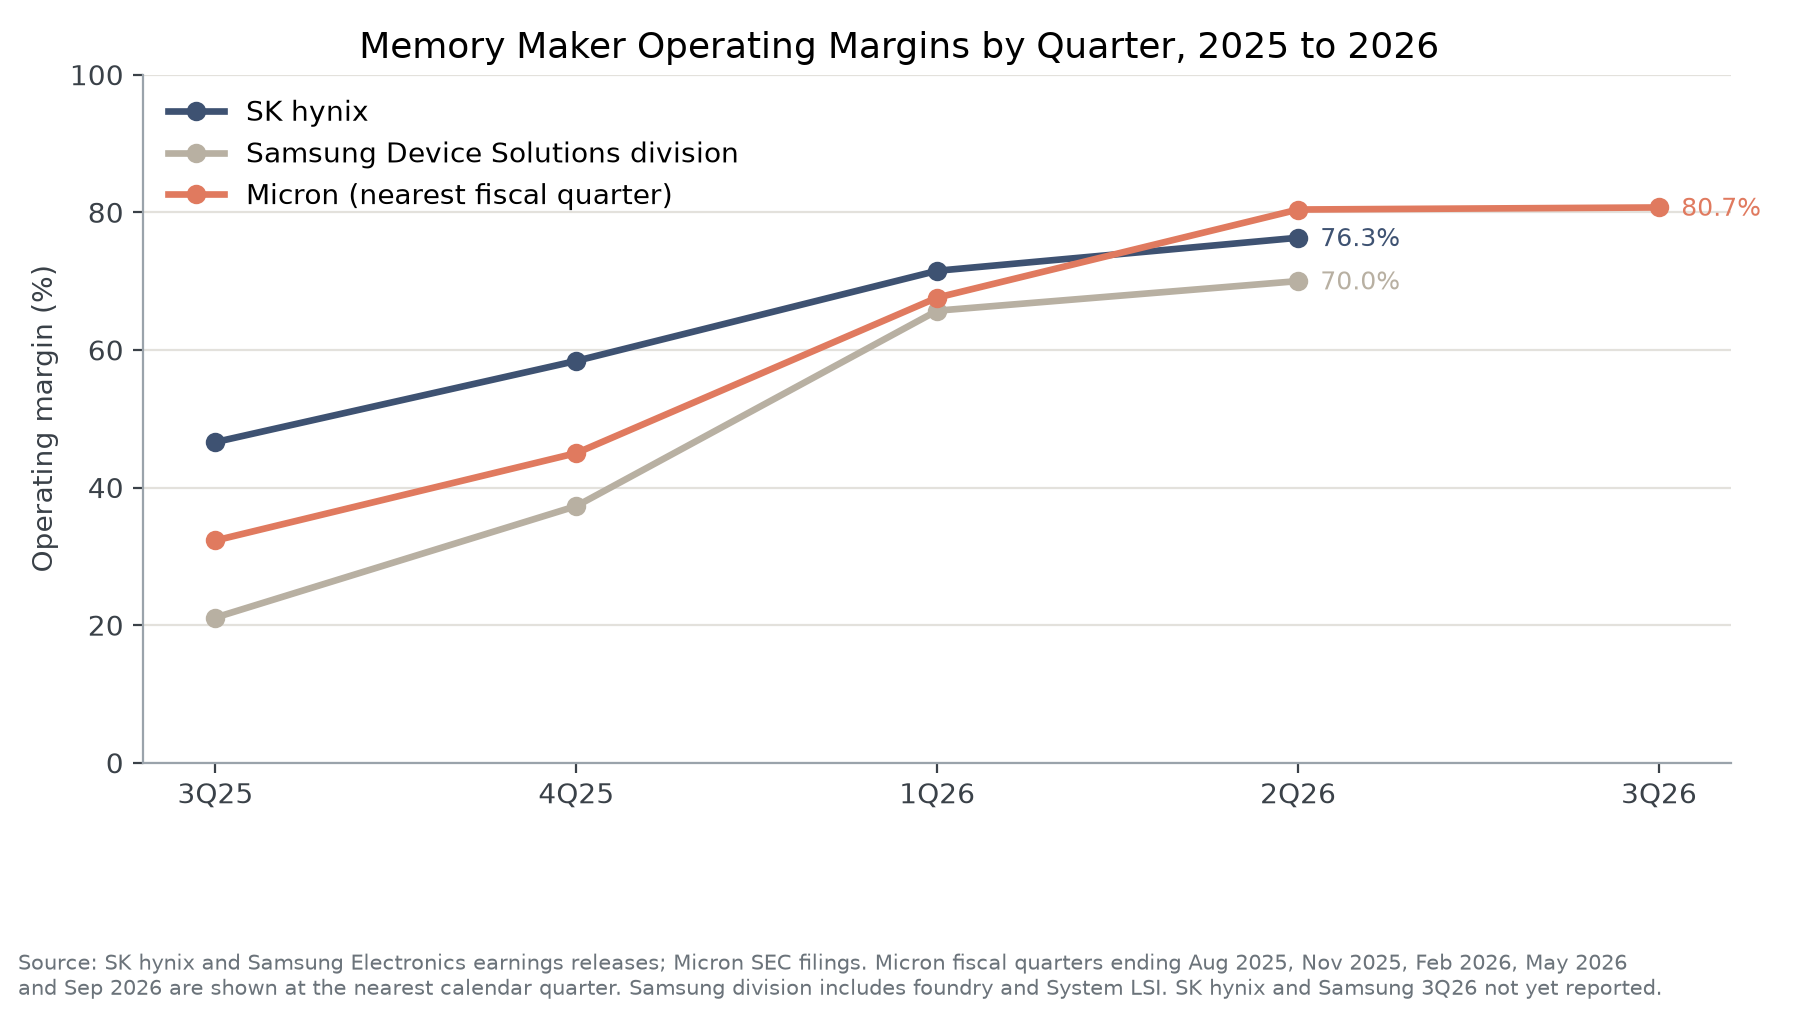
- Micron's GAAP gross margin climbed from 44.7% in fiscal Q4 2025 to 86.8% a year later, and SK hynix reported a 76.3% operating margin for the second quarter of 2026.
- The US producer price index for computer storage devices rose 87.3% in the year to September 2026, and Apple, Dell, Lenovo, HP, and Raspberry Pi all raised device prices, citing memory costs.
- Sourceability's Q3 2026 report shows lead times of 52 weeks on several Micron DRAM technologies and 24 to 52 weeks on SSD lines, and smaller device makers told Reuters the shortage should last through 2027.
Every AI server needs large amounts of memory, both the high-bandwidth memory (HBM) stacked next to each accelerator and the conventional DRAM and flash storage that hold models, data, and context while they run. Three companies, Samsung, SK hynix, and Micron, make most of the world's DRAM, and over the past year they have moved factory capacity toward HBM and server products for data center buyers. Phones, laptops, graphics cards, and consumer SSDs draw on the same supply, and the companies that build them have had to compete for what is left.
That competition has shown up in prices at every step of the chain, so we measured how far they have moved.
In the following sections, we track contract and spot memory prices by quarter, show how much the three memory makers earned from them, follow the increases into US price indexes and retail products, and lay out how long buyers now wait for supply.
Memory Contract Prices by Quarter
This section covers contract prices, the negotiated prices that large buyers such as PC, phone, and server makers pay memory suppliers each quarter. TrendForce publishes a forecast range for each quarter and then revises it once the quarter is over, so the table marks which figures are reported after the quarter and which are still estimates or forecasts.
Quarter-over-quarter change in memory contract prices
| Quarter | Status | Conventional DRAM | HBM (blended) | NAND flash |
|---|---|---|---|---|
| 4Q25 | Reported | +45% to +50% | +50% to +55% | +33% to +38% |
| 1Q26 | DRAM reported; HBM and NAND estimated | +93% to +98% | +80% to +85% | +85% to +90% |
| 2Q26 | Reported | +58% to +63% | +53% to +58% | +55% to +60% |
| 3Q26 | Estimate | +13% to +18% | +8% to +13% | +18% to +23% |
| 4Q26 | Forecast | +10% to +15% | +15% to +20% | +15% to +20% |
| 4Q25 to 2Q26 combined | Reported quarters | 4.4x to 4.8x the 3Q25 level | n/a | n/a |
Source: TrendForce price tables and press releases dated February 2, February 26, March 31, June 1, July 3, and September 30, 2026. Conventional DRAM excludes HBM.
Key Findings
- Taken together, the three reported DRAM quarters from October 2025 through June 2026 multiply to about 4.4 to 4.8 times the third-quarter 2025 contract price, by our calculation from TrendForce's low and high ends. In September 2025, TrendForce had expected fourth-quarter DRAM prices to rise only 8% to 13%, so the move was several times larger than the industry's own forecast.
- By product, TrendForce's 4Q25 table showed server DRAM up 53% to 58% and PC DRAM up 38% to 43%, while enterprise SSD contract prices rose 25% to 30%. Suppliers sent their first and largest increases to the data center products that AI buyers wanted most.
- For buyers, the latest TrendForce figures point to slower increases, not falling prices. Its September forecast still has every major category rising in the fourth quarter of 2026, and enterprise SSD is the one category where TrendForce expects the increase to speed up.
DRAM and NAND Spot Prices
This section tracks spot prices, which are set day to day in trading between distributors, module makers, and smaller buyers. Spot prices react faster than contract prices and give an early read on where the market is heading.
DRAM and NAND spot price averages (US$)
| Date | DDR4 8Gb 3200 chip | 512Gb TLC NAND wafer |
|---|---|---|
| October 2025 | 7.931 | 4.576 |
| January 14, 2026 | 27.857 | 15.052 |
| March 30-31, 2026 | 33.960 | 22.155 |
| June 29-30, 2026 | 36.000 | 19.862 |
| October 19-20, 2026 | 46.357 | 18.592 |
| Change, October 2025 to October 2026 | +484.5% | +306.3% |
| Change, March 2026 to October 2026 | +36.5% | -16.1% |
Source: TrendForce weekly memory spot price updates, citing DRAMeXchange. The October 2025 DDR4 figure is from October 22 and the TLC figure from the same weekly update.

Key Findings
- The DDR4 8Gb chip average rose 484.5% in a year, from $7.931 to $46.357. On October 23, 2026, DRAMeXchange showed a session average of $61.267 for a DDR5 16Gb chip and $82.870 for a DDR4 16Gb chip.
- NAND wafer spot prices peaked in late March 2026 and have eased since, and the 512Gb TLC average in October 2026 was 16.1% below its March level. The wafer still traded at about four times its October 2025 price.
- The split matters for anyone timing a purchase. Flash spot prices have started to cool while DRAM spot prices are still climbing, which suggests storage relief may arrive before memory relief, though TrendForce's contract forecasts show both still rising through year-end.
Module prices show the same pattern at the retail end of the spot market. DRAMeXchange's module survey, last updated October 12, 2026, put a 16GB DDR5 desktop module at $239.00, a 16GB DDR4 desktop module at $165.90 and a 32GB DDR5 server module at $2,185.00.
DRAM Industry Revenue by Supplier
This section shows how higher prices turned into revenue for DRAM makers. TrendForce calculates industry revenue each quarter from supplier results and its own price and shipment data.
DRAM industry revenue by quarter (US$ billions)
| Quarter | Industry total | Change from prior quarter | Samsung | SK hynix | Micron |
|---|---|---|---|---|---|
| 3Q25 | 41.40 | +30.9% | n/a | n/a | n/a |
| 4Q25 | 53.58 | +29.4% | 19.30 | 17.22 | 11.98 |
| 1Q26 | 97.00 | +81.0% | 37.32 | 27.98 | 21.75 |
| 2Q26 | 154.73 | +59.5% | 60.98 | 38.59 | 36.00 |
Source: TrendForce DRAM revenue press releases dated November 26, 2025, February 26, June 1, and September 7, 2026. n/a = not used in this report.
Key Findings
- Quarterly DRAM industry revenue grew to about 3.7 times its 3Q25 level within three quarters. Samsung held a 39.4% share in 2Q26, SK hynix 24.9%, and Micron 23.3%, and smaller suppliers Nanya and Winbond reported $2.612 billion and $998 million.
- NAND makers saw a similar jump. TrendForce put combined 2Q26 revenue for the five largest NAND brands at $68.87 billion, up 77% from the prior quarter, led by Samsung at about $23.06 billion and SK hynix Group at $14.27 billion.
- Most of this growth came from price, not volume. Micron's 10-K attributes its fiscal 2026 DRAM revenue growth to average selling prices up roughly 180%, against bit shipments up only in the mid-20% range.
Micron Revenue and Margins from SEC Filings
This section uses Micron's SEC filings, the most detailed US-reported view of what the shortage has done to a memory maker's results. Micron's fiscal 2026 ended on September 3, 2026, and its fourth quarter ran 14 weeks.
Micron quarterly results, GAAP (US$ millions)
| Fiscal quarter (end date) | Revenue | Gross profit | Gross margin | Operating income | Operating margin | Net income |
|---|---|---|---|---|---|---|
| FQ4 2025 (Aug 28, 2025) | 11,315 | 5,054 | 44.7% | 3,654 | 32.3% | 3,201 |
| FQ1 2026 (Nov 27, 2025) | 13,643 | 7,646 | 56.0% | 6,136 | 45.0% | 5,240 |
| FQ2 2026 (Feb 26, 2026) | 23,860 | 17,755 | 74.4% | 16,135 | 67.6% | 13,785 |
| FQ3 2026 (May 28, 2026) | 41,456 | 35,056 | 84.6% | 33,318 | 80.4% | 28,243 |
| FQ4 2026 (Sep 3, 2026) | 54,229 | 47,047 | 86.8% | 43,751 | 80.7% | 37,701 |
| Fiscal 2026 | 133,188 | n/a | 80.7% | 99,340 | 74.6% | 84,969 |
| Fiscal 2025 | 37,378 | n/a | 39.8% | n/a | 26.1% | 8,539 |
Source: AI Industry Reviews analysis of Micron Technology Form 10-K for fiscal 2026 (filed October 9, 2026) and Form 10-Q filings, via SEC XBRL data. FQ4 2026 values are fiscal-year totals minus the first three quarters.

Key Findings
- Micron's fiscal 2026 revenue rose 256.3% to $133.19 billion. DRAM brought in $100.68 billion, up 252%, and NAND $31.79 billion, up 274% on average selling prices about 200% higher, according to the 10-K.
- Prices were still rising at the end of the year. In fiscal Q4, Micron said DRAM prices rose in the high-teens percentage range from the prior quarter and NAND prices about 30%, while DRAM bit shipments grew only in the mid-single digits.
- Customers are paying up front to lock in supply. Micron has signed 26 multi-year take-or-pay agreements that it estimates at over 35% of revenue through 2030, with $32 billion in customer commitments, mostly cash deposits, and it says even the floor prices in those contracts imply margins well above its past peaks.
SK hynix and Samsung Results in US Dollars
This section converts SK hynix results and Samsung's Device Solutions division, which holds its memory business, into US dollars at one fixed rate of 1,421.3963 won per dollar. Samsung reports memory only as part of that division, which also includes its foundry and System LSI chip businesses.
SK hynix and Samsung Device Solutions results (US$ billions)
| Quarter | SK hynix revenue | SK hynix operating profit | SK hynix operating margin | Samsung DS revenue | Samsung DS operating profit | Samsung DS operating margin |
|---|---|---|---|---|---|---|
| 3Q25 | 17.20 | 8.01 | 46.6% | 23.29 | 4.92 | 21.1% |
| 4Q25 | 23.09 | 13.49 | 58.4% | 30.96 | 11.54 | 37.3% |
| 1Q26 | 36.99 | 26.46 | 71.5% | 57.48 | 37.78 | 65.7% |
| 2Q26 | 55.80 | 42.59 | 76.3% | 89.70 | 62.76 | 70.0% |
| Full year 2025 | 68.35 | 33.21 | 48.6% | n/a | n/a | n/a |
Source: AI Industry Reviews analysis of SK hynix and Samsung Electronics quarterly earnings releases, converted at the Federal Reserve's 2025 average of 1,421.3963 won per US dollar. Margins are calculated from won values.
Key Findings
- SK hynix's 2Q26 revenue of $55.80 billion was more than three times its 3Q25 figure. Its full-year 2025 operating profit came to $33.21 billion on revenue of $68.35 billion.
- Samsung's preliminary guidance for the third quarter of 2026, released October 8, points to company-wide sales of about $137.19 billion and operating profit of about $75.56 billion at our fixed rate, before detailed results due October 29. The guidance does not break out the chip division.
- The same shortage that lifted Samsung's chip profits squeezed its phone business. Samsung's mobile and networks unit swung from a $2.53 billion operating profit in 3Q25 to a $0.49 billion loss in 2Q26, which the company tied to higher component costs across the industry.
Samsung company-wide and mobile results (US$ billions)
| Quarter | Company revenue | Company operating profit | Mobile and networks operating profit (loss) |
|---|---|---|---|
| 3Q25 | 60.55 | 8.56 | 2.53 |
| 2Q26 | 120.66 | 62.97 | (0.49) |
| 3Q26, preliminary guidance | 137.19 | 75.56 | not reported |
Source: AI Industry Reviews analysis of Samsung Electronics earnings releases and October 8, 2026 guidance, converted at 1,421.3963 won per US dollar.
Memory Costs in US Producer and Consumer Price Indexes
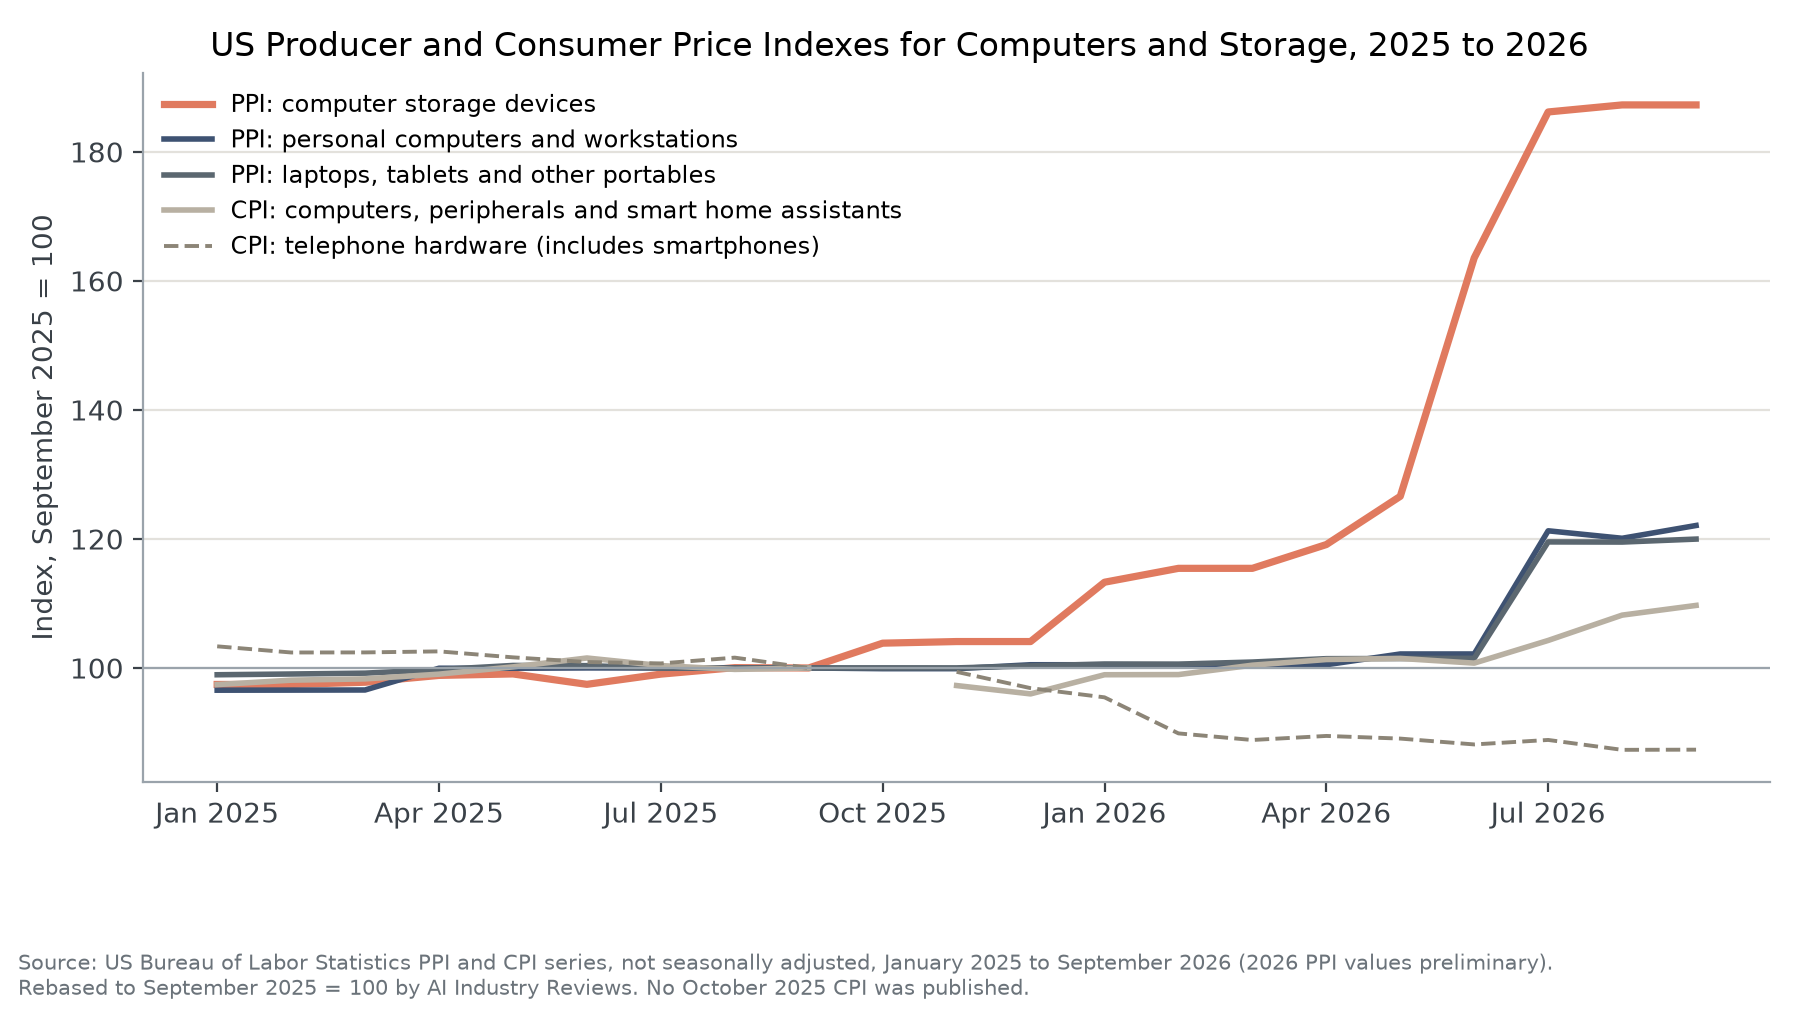
This section uses Bureau of Labor Statistics price indexes, the official US measures of what manufacturers charge and what households pay. The BLS does not publish a separate index for memory chips, so the closest measures are storage devices, computers, and the devices built from them.
US price indexes, September 2025 to September 2026
| Index (BLS series) | September 2025 | September 2026 | Change |
|---|---|---|---|
| PPI: computer storage device manufacturing (PCU334112334112) | 62.597 | 117.231 | +87.3% |
| PPI: personal computers and workstations (PCU33411133411173) | 104.805 | 127.954 | +22.1% |
| PPI: laptops, tablets and other portables (PCU33411133411172) | 96.827 | 116.173 | +20.0% |
| PPI: electronic computer manufacturing (PCU334111334111) | 100.369 | 103.337 | +3.0% |
| PPI: semiconductor and related devices (PCU334413334413) | 29.450 | 28.801 | -2.2% |
| CPI: computer software and accessories (CUUR0000SEEE02) | 21.991 | 28.234 | +28.4% |
| CPI: computers, peripherals and smart home assistants (CUUR0000SEEE01) | 35.141 | 38.549 | +9.7% |
| CPI: telephone hardware, calculators and other items (CUUR0000SEEE04) | 96.261 | 84.073 | -12.7% |
| CPI: all items (CUUR0000SA0) | 324.800 | 336.940 | +3.7% |
Source: AI Industry Reviews analysis of US Bureau of Labor Statistics data, not seasonally adjusted. Producer price index values for 2026 are preliminary.
Key Findings
- Producer prices for storage devices, which include SSDs, rose faster than any other series we tracked, and most of the increase came between May and July 2026. Desktop and laptop producer prices rose about a fifth, mostly in a single step in July.
- Consumer prices for computers and peripherals rose 9.7%, more than two and a half times the overall inflation rate. The broad semiconductor producer index fell, because it is weighted toward processors and other chips and is adjusted for quality gains, which shows why it is a poor gauge of memory prices.
- The phone index fell 12.7% even as phone makers reported rising costs. The BLS adjusts phone prices for improvements in features and performance, so the index may lag sticker-price increases, and households replacing phones should not read it as a sign that phones got cheaper.
Price Increases on PCs, Tablets, GPUs, and SSDs
This section lists price increases that device makers announced or that retail price tracking recorded, where the company or source tied the increase to memory and storage costs.
Announced and tracked device price increases
| Product | Before | After | Change | Date | Source |
|---|---|---|---|---|---|
| MacBook Air, starting price | $1,099 | $1,299 | +$200 | June 2026 | MacRumors, citing Apple |
| MacBook Pro, starting price | $1,699 | $1,999 | +$300 | June 2026 | MacRumors, citing Apple |
| iPad, starting price | $349 | $449 | +$100 | June 2026 | MacRumors, citing Apple |
| Mac Studio (M3 Ultra), starting price | $3,999 | $5,299 | +$1,300 | June 2026 | MacRumors, citing Apple |
| Dell PCs | n/a | n/a | at least 15% to 20% (expected) | December 2025 | TrendForce, citing industry sources |
| Raspberry Pi 5, 2GB | $65.00 | $77.50 | +$12.50 | October 2026 | Raspberry Pi |
| RTX 5070 graphics card, Newegg median | $659.99 | $899.99 | +36% | June to August 2026 | Tom's Hardware |
| RTX 5060 Ti 16GB, Newegg median | $569.99 | $804.99 | +39% | June to August 2026 | Tom's Hardware |
| 2TB NVMe SSD, average of four models | $168.75 | $357.50 | +113.7% | Nov 2025 to Mar 2026 | GamersNexus, Newegg prices |
| 2TB SATA SSD, average of four models | $147.75 | $260.00 | +76.3% | Nov 2025 to Mar 2026 | GamersNexus, Newegg prices |
Source: AI Industry Reviews compilation from the sources shown in each row. The Raspberry Pi starting price is calculated from the $12.50 increase and new $77.50 price.
Key Findings
- Apple raised starting prices on 14 products in June 2026, including every Mac and iPad, and said it had "never seen a component price increase this much, this quickly." iPhone prices were not changed at the time.
- HP said memory and storage made up roughly 15% to 18% of its PC bill of materials in late 2025 and that it expected the share to reach about 35% for the year. Lenovo told customers that all quotes would expire on January 1, 2026, ahead of its own increases.
- Graphics cards held near their earlier prices longer than memory and SSDs, then jumped in mid-2026. Tom's Hardware found Nvidia's mid-range cards were hit hardest while the RTX 5070 Ti median did not move, so buyers comparing cards now face a much smaller gap between the mid-range and the next tier up.
Allocation and Lead Times for Memory Orders
This section covers how long buyers wait for memory and whether they can get it at all. When demand exceeds supply, suppliers move to allocation, giving each customer a fixed share of output instead of filling orders as placed.
Published lead times for memory products
| Product | Supplier | Lead time | Period | Source |
|---|---|---|---|---|
| DRAM | Micron | 52 weeks, allocation | Q1 2026 | Sourceability |
| DRAM | Samsung | 30 to 42 weeks | Q1 2026 | Sourceability |
| DDR5 | Samsung | 20 to 28 weeks, DDR5 allocation only | Q1 2026 | Sourceability |
| DDR4 and LPDDR4 | Samsung | 26 to 34 weeks | Q1 2026 | Sourceability |
| Several DRAM technologies | Micron | 52 weeks | Q3 2026 | Sourceability |
| SSD lines | Most manufacturers | 24 to 52 weeks, allocation | Q3 2026 | Sourceability |
Source: Sourceability Q1 2026 Lead Time Report and Q3 2026 Lead Time Report highlights (October 2026).
Key Findings
- Sourceability said in October 2026 that DDR4, LPDDR5, and select DDR5 products remain on allocation "almost across the board," and that buyers had received 27 price increase notices from 20 major component manufacturers. Its Q1 2026 report said contracts for volatile memory run through 2028.
- Micron's 10-K states that when demand exceeds supply it uses customer and market supply allocations, and that shortages and longer lead times for some of its own materials are currently occurring. In 2Q26, SK hynix said customer demand exceeded its supply capabilities and that it had long-term agreements with around 10 customers.
- Smaller phone and laptop makers told Reuters in September 2026 that availability, not price, had become their main constraint, and that they expected the shortage to last through 2027. For a small hardware company, a supply agreement may now matter more than a lower quote.
What Outside Forecasts Say About Memory Prices
This section adds outside forecasts. They are projections, not results, and are included to show where analysts expect prices to go.
Key Findings
- Gartner projected in February 2026 that combined DRAM and SSD prices would rise 130% by the end of 2026, raising average PC prices 17% and smartphone prices 13% compared with 2025, and that global PC and smartphone shipments would fall 10.4% and 8.4%. Gartner made those projections before the second-quarter contract increases were known.
- Micron expects memory and storage supply to be much tighter in 2027 and 2028 than in 2026, with industry DRAM bit shipments growing in the low-20% range in both years, and says it has no line of sight to when supply and demand will return to balance. It has contracted the vast majority of its calendar 2027 HBM supply at significantly higher prices than in 2026.
- New supply is at least several quarters away. Micron expects first wafer output from its new Boise DRAM fab in mid-calendar 2027, with the second Idaho fab starting output by late 2028.
What These Numbers Mean for Memory Buyers
The shortage has moved money from device makers and their customers to the three memory suppliers. Micron, SK hynix, and Samsung's chip division went from operating margins between 21% and 47% in the third quarter of 2025 to 70% or more by mid-2026, while Samsung's own phone business lost money in the second quarter of 2026. Apple's Mac and iPad starting-price increases of $100 to $1,300 show that even the largest buyers could not absorb all of the cost.
The pressure is also changing who gets supply. Multi-year take-or-pay contracts, cash deposits, and allocation now decide which customers are served first, and the biggest data center buyers have locked up capacity years ahead. Smaller device makers face year-long waits on some parts regardless of what they are willing to pay.
Price increases are slowing, but they have not stopped. TrendForce's estimates for the second half of 2026 are far below the gains of early 2026 and still positive in every category, and the new fabs that would add meaningful supply are not due until 2027 and 2028. So if you are budgeting for PCs, servers, or storage over the next year, budget as though today's memory prices will hold, since every current TrendForce forecast still points up, and secure supply commitments before you negotiate on price.
Data Collection and Methodology
Data was collected on October 23, 2026, and compiled in November 2026.
Contract prices come from TrendForce's quarterly price tables for conventional DRAM (which excludes HBM), blended HBM and NAND flash. TrendForce gives each quarter as a range of percentage change from the prior quarter and revises the range after the quarter ends. We used the latest published range for each quarter and labeled it as reported if TrendForce published it after the quarter ended, as an estimate if the quarter was under way or just finished but not yet confirmed, and as a forecast if the quarter had not started. Charts show the midpoint of each range with the full range marked. The cumulative DRAM figure multiplies the low ends and the high ends of the three reported quarters, 4Q25 through 2Q26, and is our own calculation, not a TrendForce figure. We did not use an October 2026 press report citing roughly 80% and 40% DRAM increases for the second and third quarters, because those figures conflict with TrendForce's own tables.
Spot prices are the session or weekly averages for the DDR4 8Gb 3200 mainstream chip and the 512Gb TLC NAND wafer published in TrendForce's weekly spot price updates, which draw on DRAMeXchange. We used the update closest to the end of each quarter plus the most recent one. Spot prices are quoted per chip or per wafer in US dollars.
Micron figures come from the structured financial data (XBRL company facts) filed with its 10-K and 10-Q reports, keeping the most recently filed value for each period. Micron's fiscal year ends on the Thursday closest to August 31, and fiscal 2026 ended September 3, 2026. Its fiscal fourth quarter of 2026 ran 14 weeks, and we calculated it as the fiscal-year total minus the first three quarters. All Micron figures are GAAP; Micron's non-GAAP margins in its earnings release are slightly higher. In the margin chart, Micron's fiscal quarters are placed at the nearest calendar quarter.
SK hynix and Samsung report in Korean won. We converted every quarter at one fixed rate, 1,421.3963 won per US dollar, the Federal Reserve's annual average for 2025 from its G.5A release. Using one rate keeps changes over time tied to the companies' results, not to currency moves. Margins were calculated from the won figures, so they are unaffected by the conversion. Samsung's Device Solutions division includes memory, foundry, and System LSI, and Samsung does not report memory profit separately. We used only operating profit for SK hynix, because its reported second-quarter 2026 net profit exceeded its revenue, reflecting large items outside its operations. SK hynix and Samsung had not reported detailed third-quarter 2026 results by the collection date, so the only third-quarter figure for either company is Samsung's preliminary company-wide guidance.
TrendForce DRAM revenue figures are TrendForce's own estimates of supplier DRAM revenue and differ from company-reported totals, which also include NAND and other products.
BLS figures are not seasonally adjusted index values. The most recent four months of producer price index values are preliminary and may be revised. The BLS did not publish an October 2025 CPI, so the consumer price lines in the price index chart skip that month. Percentage changes and the September 2025 rebasing in the price index chart are our calculations from the published index values. The BLS does not publish a price index for memory chips.
Device price increases include only cases where the company, or the source reporting the increase, tied it to memory or storage costs, and where before and after prices or a stated percentage were available. Retail medians and averages are as calculated by Tom's Hardware and GamersNexus from Newegg prices. Lead times are as published by Sourceability, a component distributor, and reflect quotes to its customers, not an industry-wide average.
Forecasts from TrendForce, Gartner, and Micron are labeled as such and are not used in any reported total. Percentages and multiples were calculated from unrounded values and rounded once.
Sources
- AI Industry Reviews, AI Memory Shortage Price Statistics: 2026 Report. Our own study, conducted November 2026, aggregating TrendForce and DRAMeXchange memory prices, Micron SEC filings, SK hynix and Samsung earnings releases converted to US dollars, US Bureau of Labor Statistics price indexes, announced device price increases, and published lead times.
- TrendForce, 4Q25 and revised 1Q26 memory contract price table, press release, February 2, 2026. https://www.trendforce.com/presscenter/news/20260202-12911.html
- TrendForce, 4Q25 DRAM industry revenue by supplier, press release, February 26, 2026. https://www.trendforce.com/presscenter/news/20260226-12937.html
- TrendForce, 1Q26 and 2Q26 memory contract price table, press release, March 31, 2026. https://www.trendforce.com/presscenter/news/20260331-12995.html
- TrendForce, "Rapid Contract Price Surge Drives 1Q26 DRAM Industry Up 81% QoQ," press release, June 1, 2026. https://www.trendforce.com/presscenter/news/20260601-13070.html
- TrendForce, 2Q26 and 3Q26 memory contract price table, press release, July 3, 2026. https://www.trendforce.com/presscenter/news/20260703-13134.html
- TrendForce, 3Q26 and 4Q26 memory contract price table, press release, September 30, 2026. https://www.trendforce.com/presscenter/news/20260930-13258.html
- TrendForce, 4Q25 DRAM and NAND contract price forecasts, September 25 and September 30, 2025. https://www.trendforce.com/presscenter/news/20250925-12736.html and https://www.trendforce.com/news/2025/09/30/
- TrendForce, 3Q25 DRAM industry revenue, press release, November 26, 2025. https://www.trendforce.com/presscenter/news/20251126-12802.html
- TrendForce, 2Q26 DRAM industry revenue by supplier, press release, September 7, 2026. https://www.trendforce.com/presscenter/news/20260907-13219.html
- TrendForce, 2Q26 NAND flash revenue of the top five brands, press release, August 18, 2026. https://www.trendforce.com/presscenter/news/20260818-13186.html
- TrendForce, weekly memory spot price updates citing DRAMeXchange, October 22, 2025; January 14, April 1, July 1 and October 21, 2026. https://www.trendforce.com/news/2025/10/22/insights-memory-spot-price-update-ddr4-ddr5-trading-surges-as-buyers-hedge-price-risks-mainstream-ddr4-up-9/ ; https://www.trendforce.com/news/2026/01/14/insights-memory-spot-price-update-dram-surges-as-sellers-hold-back-inventory-mainstream-ddr4-up-nearly-10/ ; https://www.trendforce.com/news/2026/04/01/insights-memory-spot-price-update-ddr3-strength-contrasts-weak-ddr4-and-ddr5-amid-high-prices-and-soft-demand/ ; https://www.trendforce.com/news/2026/07/01/insights-memory-spot-price-update-dram-spot-prices-see-gains-in-low-density-ddr4-and-ddr3-amid-sideways-market/ ; https://www.trendforce.com/news/2026/10/21/insights-memory-spot-price-update-ddr5-supply-tight-ddr4-trading-subdued-despite-0-84-gain-in-mainstream-prices/
- DRAMeXchange, DRAM spot session averages (October 23, 2026) and module spot prices (last updated October 12, 2026). https://www.dramexchange.com/
- Micron Technology, Form 10-K for the fiscal year ended September 3, 2026, filed October 9, 2026 (accession 0000723125-26-000023), and Forms 10-Q for fiscal 2026, via SEC EDGAR XBRL company facts. https://www.sec.gov/cgi-bin/browse-edgar?action=getcompany&CIK=0000723125
- Micron Technology, fiscal Q4 2026 earnings release and earnings call prepared remarks, September 30, 2026. https://investors.micron.com/ and https://s25.q4cdn.com/621799436/files/doc_financials/2026/q4/Q4-FY26-Prepared-Remarks.pdf
- SK hynix, "SK hynix Announces FY25 Financial Results" (4Q25, 3Q25 and full-year 2025 figures), January 2026. https://news.skhynix.com/en/sk-hynix-announces-fy25-financial-results/
- SK hynix, "SK hynix Announces 1Q26 Financial Results," April 22, 2026. https://news.skhynix.com/en/q1-2026-business-results/
- SK hynix, "SK hynix Announces 2Q26 Financial Results," July 2026. https://news.skhynix.com/en/q2-2026-business-results/
- Samsung Electronics, "Samsung Electronics Announces Third Quarter 2025 Results," October 30, 2025. https://news.samsung.com/global/samsung-electronics-announces-third-quarter-2025-results
- Samsung Electronics, "Samsung Electronics Announces Fourth Quarter and FY 2025 Results," January 29, 2026. https://news.samsung.com/global/samsung-electronics-announces-fourth-quarter-and-fy-2025-results
- Samsung Electronics, "Samsung Electronics Announces First Quarter 2026 Results," April 30, 2026. https://news.samsung.com/global/samsung-electronics-announces-first-quarter-2026-results
- Samsung Electronics, "Samsung Electronics Announces Second Quarter 2026 Results," July 30, 2026. https://news.samsung.com/global/samsung-electronics-announces-second-quarter-2026-results
- Samsung Electronics, earnings guidance for the third quarter of 2026, October 8, 2026. https://news.samsung.com/global/samsung-electronics-announces-earnings-guidance-for-third-quarter-2026
- Board of Governors of the Federal Reserve System, G.5A Foreign Exchange Rates (Annual), released January 5, 2026. https://www.federalreserve.gov/releases/g5a/
- US Bureau of Labor Statistics, Producer Price Index and Consumer Price Index series PCU334112334112, PCU33411133411173, PCU33411133411172, PCU334111334111, PCU334413334413, CUUR0000SEEE01, CUUR0000SEEE02, CUUR0000SEEE04 and CUUR0000SA0, accessed October 23, 2026. https://www.bls.gov/ppi/ and https://www.bls.gov/cpi/
- MacRumors, "Apple Has Raised Prices on 14 Products, Including MacBooks and More," June 29, 2026, including Apple's statement. https://www.macrumors.com/2026/06/29/apple-raised-prices-on-14-products/
- TrendForce, "Memory Crunch Hits PCs: Dell Hikes Prices 15-20% Mid-December, Lenovo from January 2026," December 5, 2025. https://www.trendforce.com/news/2025/12/05/exclusive-memory-crunch-hits-pcs-dell-hikes-prices-15-20-mid-december-lenovo-from-january-2026/
- Tom's Guide, "HP confirms RAM prices have doubled and now make up 35% of laptop component prices," February 25, 2026. https://www.tomsguide.com/computing/laptops/hp-confirms-ram-prices-have-doubled-and-now-make-up-35-percent-of-laptop-component-prices
- Raspberry Pi, "Price increases for 2GB Raspberry Pi 4 and Raspberry Pi 5," October 1, 2026. https://www.raspberrypi.com/news/price-increases-for-2gb-raspberry-pi-4-and-raspberry-pi-5/
- Tom's Hardware, "GeForce RTX 50-series GPU prices spike as much as 39% as Blackwell price hikes hit the US," August 10, 2026. https://www.tomshardware.com/pc-components/gpus/geforce-rtx-50-series-gpu-prices-spike-as-much-as-39-percent-as-blackwell-price-hikes-hit-the-us-rtx-5070-gets-a-36-percent-hike-rtx-5060-up-27-percent-at-the-median-of-newegg-listings
- GamersNexus, "SSDs: WTF?," April 2, 2026. https://gamersnexus.net/features/ssds-wtf
- Sourceability, Q1 2026 Lead Time Report. https://4191215.hs-sites.com/hubfs/LTR%20Assets/LTR_2026/2026.02_SA_LTR_Final.pdf
- Sourceability, "Q3 2026 Lead Time Report Highlights," October 14, 2026. https://sourceability.com/post/q3-2026-lead-time-report-highlights
- Reuters, "Smaller phone and laptop makers dig in for years of memory scarcity," September 16, 2026. https://www.reuters.com/business/retail-consumer/smaller-phone-laptop-makers-dig-years-memory-scarcity-2026-09-16/
- Gartner, "Gartner Says Surging Memory Costs Will Reduce Global PC and Smartphone Shipments in 2026," February 26, 2026. https://www.gartner.com/en/newsroom/press-releases/2026-02-26-gartner-says-surging-memory-costs-will-reduce-global-pc-and-smartphone-shipments-in-2026