
Home / Research / AI Job Postings Statistics & Trends
Market research · October 13, 2026
AI Job Postings Statistics & Trends: 2026 Report
 By Darin ten Bruggencate, Founder, AI Industry Reviews
Since mid-2023, US employers have been mentioning artificial intelligence in a growing share of their job postings. The trend started with data and software roles and has spread to jobs in marketing, human resources and law.
Our analysts studied job posting data from Indeed Hiring Lab. We added Lightcast data published in Stanford University's AI Index 2026. We measured how often US job postings mention AI and which jobs, places and skills lead. In September 2026, 7.15% of US job postings on Indeed mentioned AI. That is 2.01 times the 3.56% of September 2025 and 4.18 times the June 2023 low of 1.71%.
In the following sections, we track AI mentions over time, break them down by job, skill and place, and set them against total US job openings.
US AI Job Postings Statistics Over Time
For anyone watching the job market, the share of postings that mention AI shows how quickly employers have started asking for AI in the jobs they advertise.
In 2019, an average of 1.74% of US job postings on Indeed mentioned AI. The monthly share rose to 3.23% in March 2022, fell to 1.71% in June 2023 and then climbed to 7.15% in September 2026, 4.18 times its 2023 low and 2.21 times its 2022 high. September 2026 was also 2.01 times the 3.56% of September 2025. On September 30, 2026, the last day in the data, the seven-day average stood at 7.34%.
Indeed Hiring Lab attributes the rise from mid-2020 to early 2022 to machine learning and modeling work in data and computer science roles, and the decline after early 2022 to falling hiring for those roles. It links the increase that began in mid-2023 to employer demand for generative AI skills after ChatGPT and other large language models arrived in late 2022.
Average Share of US Job Postings on Indeed Mentioning AI, by Year
| Year | Average share of postings |
|---|---|
| 2019 | 1.74% |
| 2020 | 1.74% |
| 2021 | 2.37% |
| 2022 | 2.84% |
| 2023 | 1.86% |
| 2024 | 2.24% |
| 2025 | 3.28% |
| 2026 (January to September) | 5.76% |
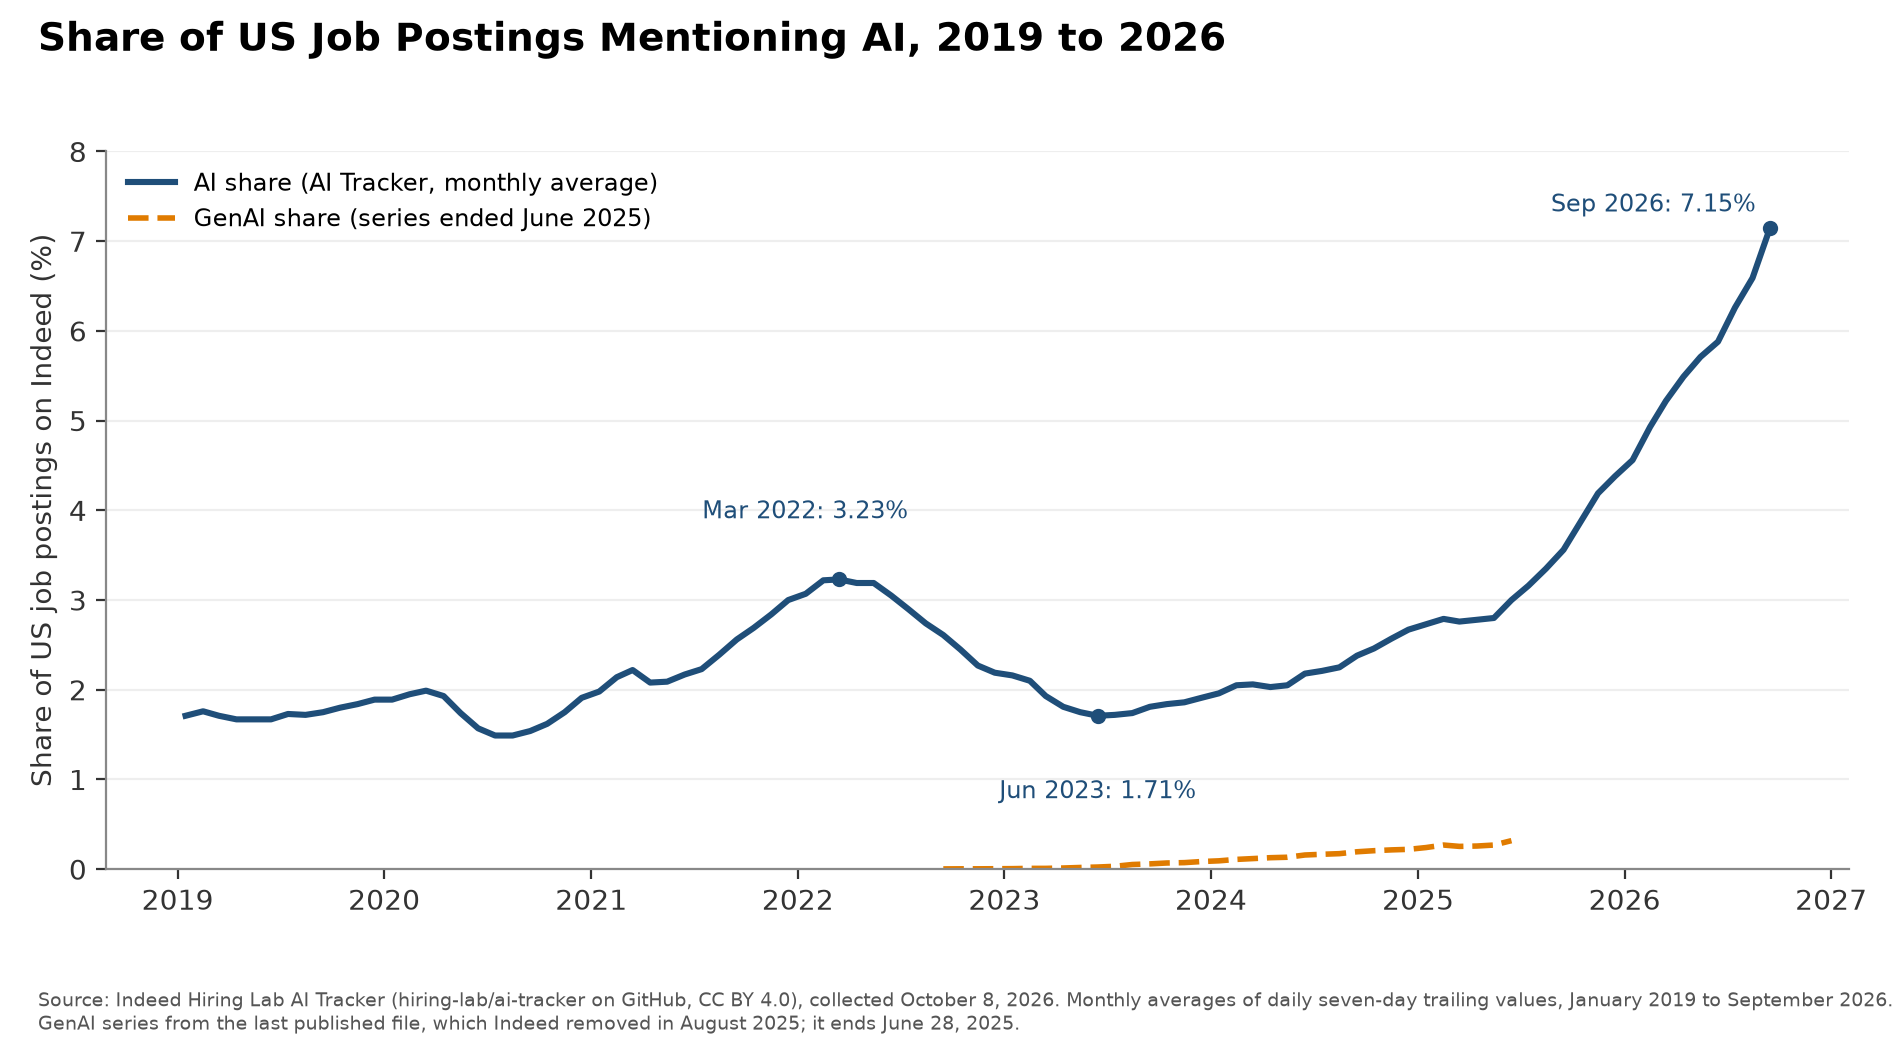
The AI share doubled over the year to September 2026 while the total number of US postings on Indeed barely changed. Indeed's Job Postings Index for all US postings averaged 102.8 in September 2025 and 103.2 in September 2026.
US AI Share of Postings and Total Postings on Indeed, September 2025 to September 2026
| Month | Share of postings mentioning AI | Job Postings Index, all US postings (Feb. 1, 2020 = 100) |
|---|---|---|
| September 2025 | 3.56% | 102.8 |
| October 2025 | 3.87% | 101.0 |
| November 2025 | 4.19% | 101.3 |
| December 2025 | 4.38% | 102.9 |
| January 2026 | 4.56% | 103.3 |
| February 2026 | 4.93% | 104.6 |
| March 2026 | 5.22% | 103.9 |
| April 2026 | 5.49% | 102.7 |
| May 2026 | 5.71% | 101.9 |
| June 2026 | 5.88% | 100.8 |
| July 2026 | 6.26% | 101.6 |
| August 2026 | 6.59% | 101.9 |
| September 2026 | 7.15% | 103.2 |
Generative AI terms appeared in a much smaller slice of postings. Indeed's generative AI share was 0.003% of US postings in September 2022 and 0.318% in June 2025. It grew 3.29 times from September 2023 to September 2024 and 2.01 times from June 2024 to June 2025.
Share of US Job Postings on Indeed Mentioning Generative AI
| Month | Share of postings |
|---|---|
| September 2022 | 0.003% |
| December 2022 | 0.005% |
| March 2023 | 0.009% |
| June 2023 | 0.024% |
| September 2023 | 0.059% |
| December 2023 | 0.085% |
| March 2024 | 0.118% |
| June 2024 | 0.158% |
| September 2024 | 0.194% |
| December 2024 | 0.221% |
| March 2025 | 0.254% |
| June 2025 (1 to 28) | 0.318% |
AI Mentions by Occupation
AI shows up far more in some kinds of work than others, and the occupation figures show where it is spreading fastest.
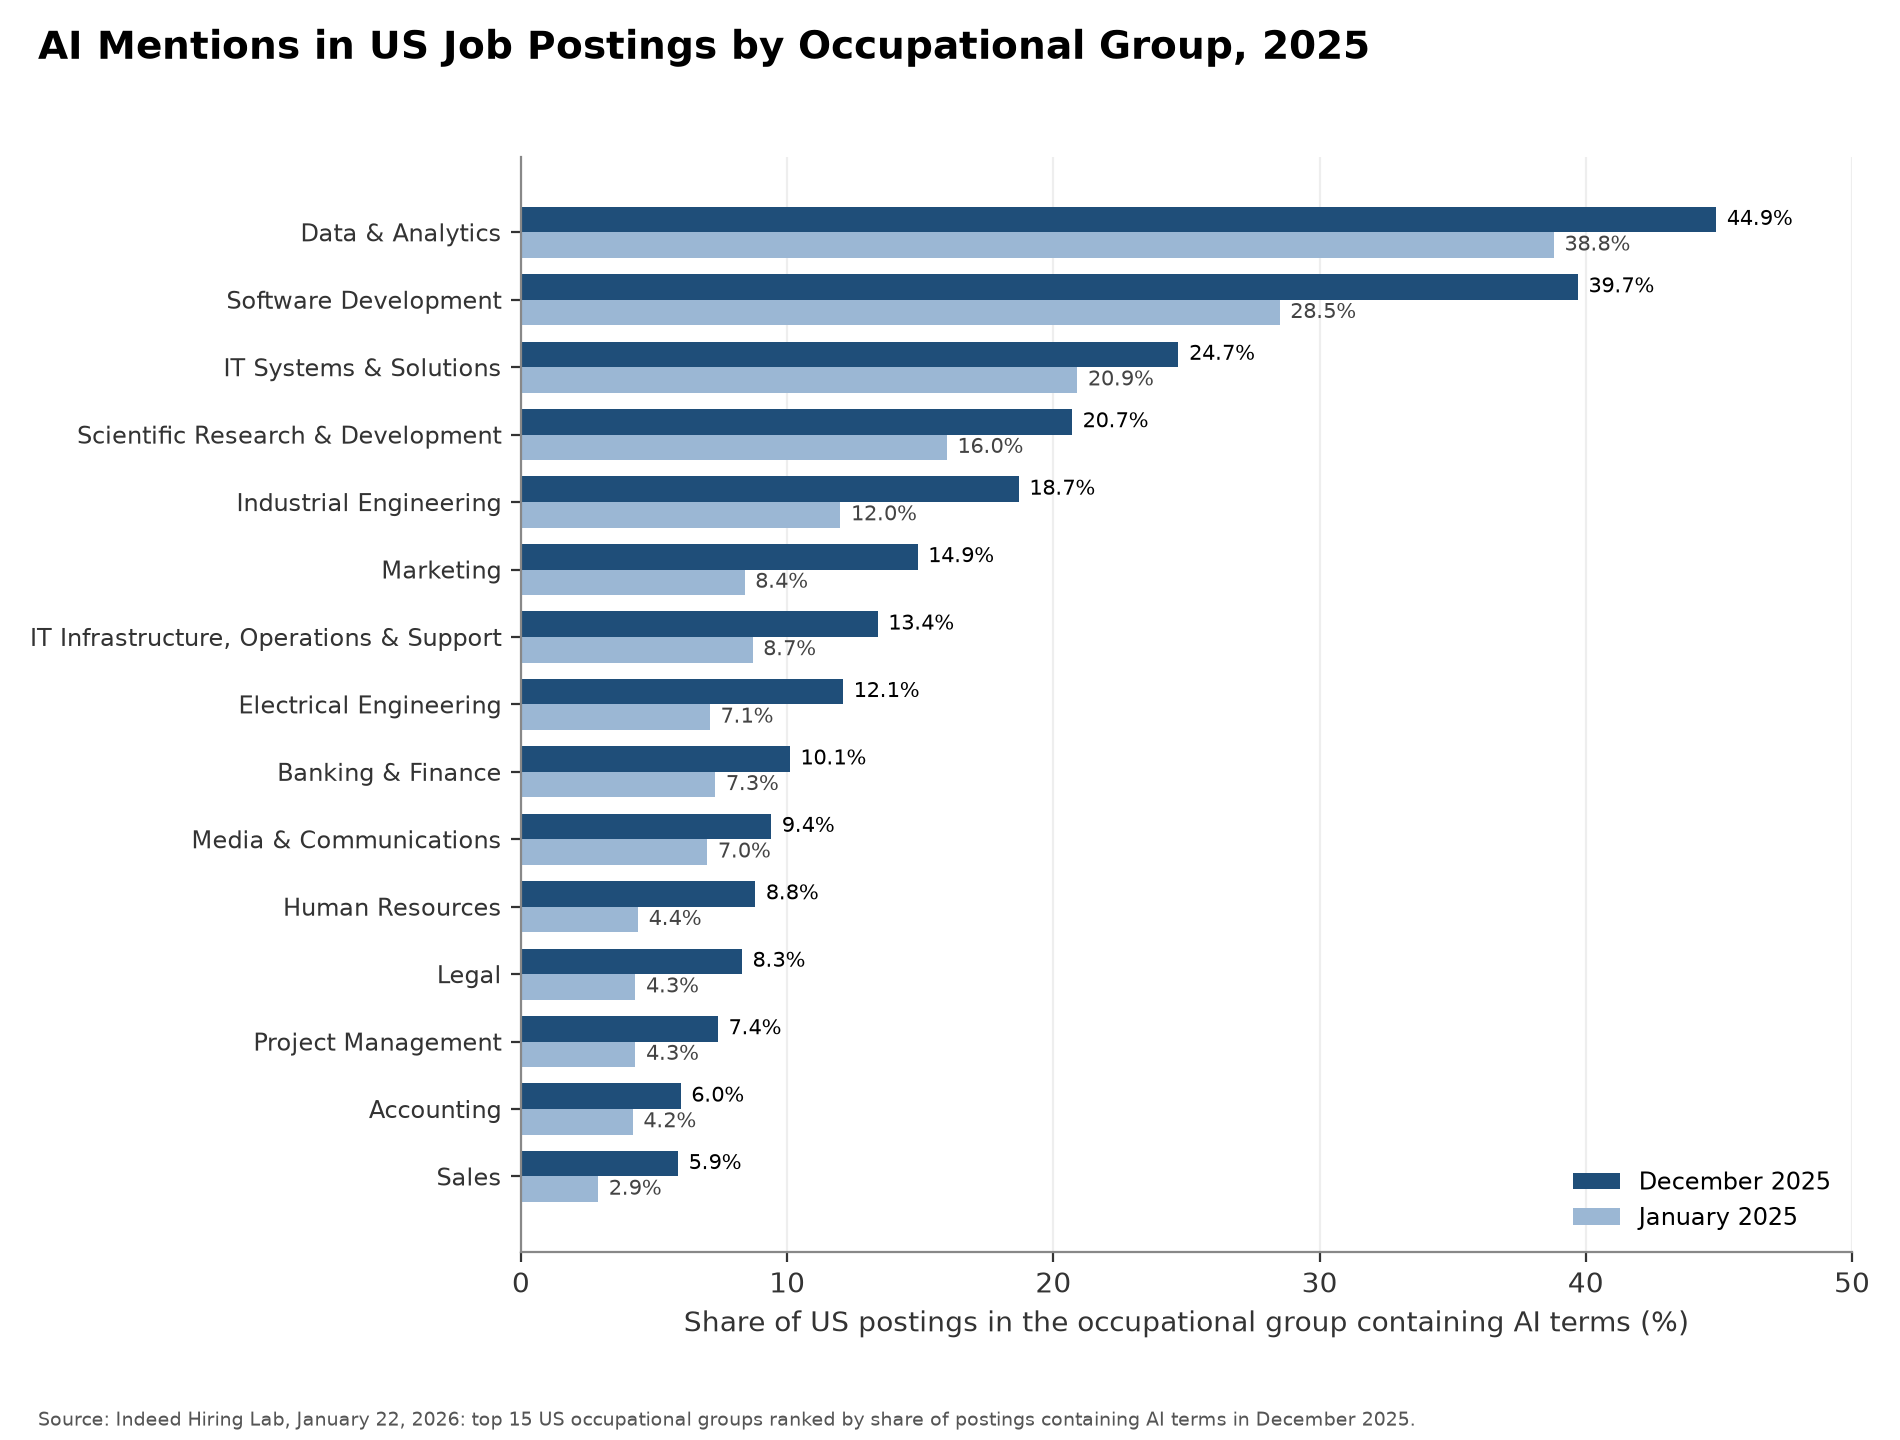
Indeed Hiring Lab ranked US occupational groups by the share of their postings that contained AI terms in December 2025. Data and analytics led at 44.9%, up from 38.8% in January 2025. Software development had the largest increase, 11.2 percentage points, reaching 39.7%. Marketing went from 8.4% to 14.9%, human resources from 4.4% to 8.8% and legal from 4.3% to 8.3%. Sales had the lowest share among the top 15 groups, 5.9%, more than double its 2.9% in January 2025.
Several of the groups with the highest AI shares had fewer postings than before the pandemic. Indeed's Job Postings Index for data and analytics averaged 59.1 in December 2025 and 61.6 in September 2026. Software development rose from 66.9 to 77.1 over the same months. Electrical engineering, at 146.6, and industrial engineering, at 119.4, were above their February 2020 levels in September 2026, while accounting fell from 111.4 to 102.5 and marketing from 79.6 to 76.3.
Share of US Postings Containing AI Terms, Top 15 Occupational Groups, and Postings Index for Each Group
| Occupational group | AI share, Jan. 2025 | AI share, Dec. 2025 | Change (percentage points) | Postings index, Dec. 2025 | Postings index, Sept. 2026 |
|---|---|---|---|---|---|
| Data & Analytics | 38.8% | 44.9% | +6.1 | 59.1 | 61.6 |
| Software Development | 28.5% | 39.7% | +11.2 | 66.9 | 77.1 |
| IT Systems & Solutions | 20.9% | 24.7% | +3.8 | 69.7 | 75.3 |
| Scientific Research & Development | 16.0% | 20.7% | +4.7 | 71.2 | 82.0 |
| Industrial Engineering | 12.0% | 18.7% | +6.7 | 91.2 | 119.4 |
| Marketing | 8.4% | 14.9% | +6.5 | 79.6 | 76.3 |
| IT Infrastructure, Operations & Support | 8.7% | 13.4% | +4.6 | 64.4 | 69.7 |
| Electrical Engineering | 7.1% | 12.1% | +5 | 120.2 | 146.6 |
| Banking & Finance | 7.3% | 10.1% | +2.8 | 98.2 | 104.9 |
| Media & Communications | 7.0% | 9.4% | +2.4 | 67.8 | 70.5 |
| Human Resources | 4.4% | 8.8% | +4.4 | 87.5 | 96.1 |
| Legal | 4.3% | 8.3% | +3.9 | 120.3 | 121.3 |
| Project Management | 4.3% | 7.4% | +3.1 | 104.0 | 116.8 |
| Accounting | 4.2% | 6.0% | +1.7 | 111.4 | 102.5 |
| Sales | 2.9% | 5.9% | +3 | 96.1 | 92.5 |
AI in Job Titles
A job title that includes AI is a stronger signal than a passing mention in the description, because it means the role itself is built around the technology.
Hiring Lab also counted standardized job titles in which at least five postings in a quarter had "AI," "GenAI," "AGI" or "artificial intelligence" in the title itself, and it calls these AI-touched titles. In the US the count fell from 264 titles in the first quarter of 2022 to 159 in the first quarter of 2023, then rose to 822 in the first quarter of 2026, 8.3% of all titles with at least five postings. Of the US titles, 63% were outside technology occupations. Germany had the most AI-touched titles of the five European countries in the study, 288, and Spain was the only one of the six countries where most AI-touched titles were in tech occupations.
Job Titles With AI in the Title, First Quarter of 2026
| Country | AI-touched job titles | Share of all titles with at least 5 postings | Share of AI-touched titles outside tech occupations |
|---|---|---|---|
| United States | 822 | 8.3% | 63% |
| Germany | 288 | 4.2% | 59% |
| United Kingdom | 160 | 2.7% | 54% |
| France | 138 | 3.3% | 54% |
| Netherlands | 84 | 2.2% | 58% |
| Spain | 81 | 2.3% | 36% |
AI Job Postings by Country
Comparing countries shows where the US stands among other economies in how often job postings mention AI.
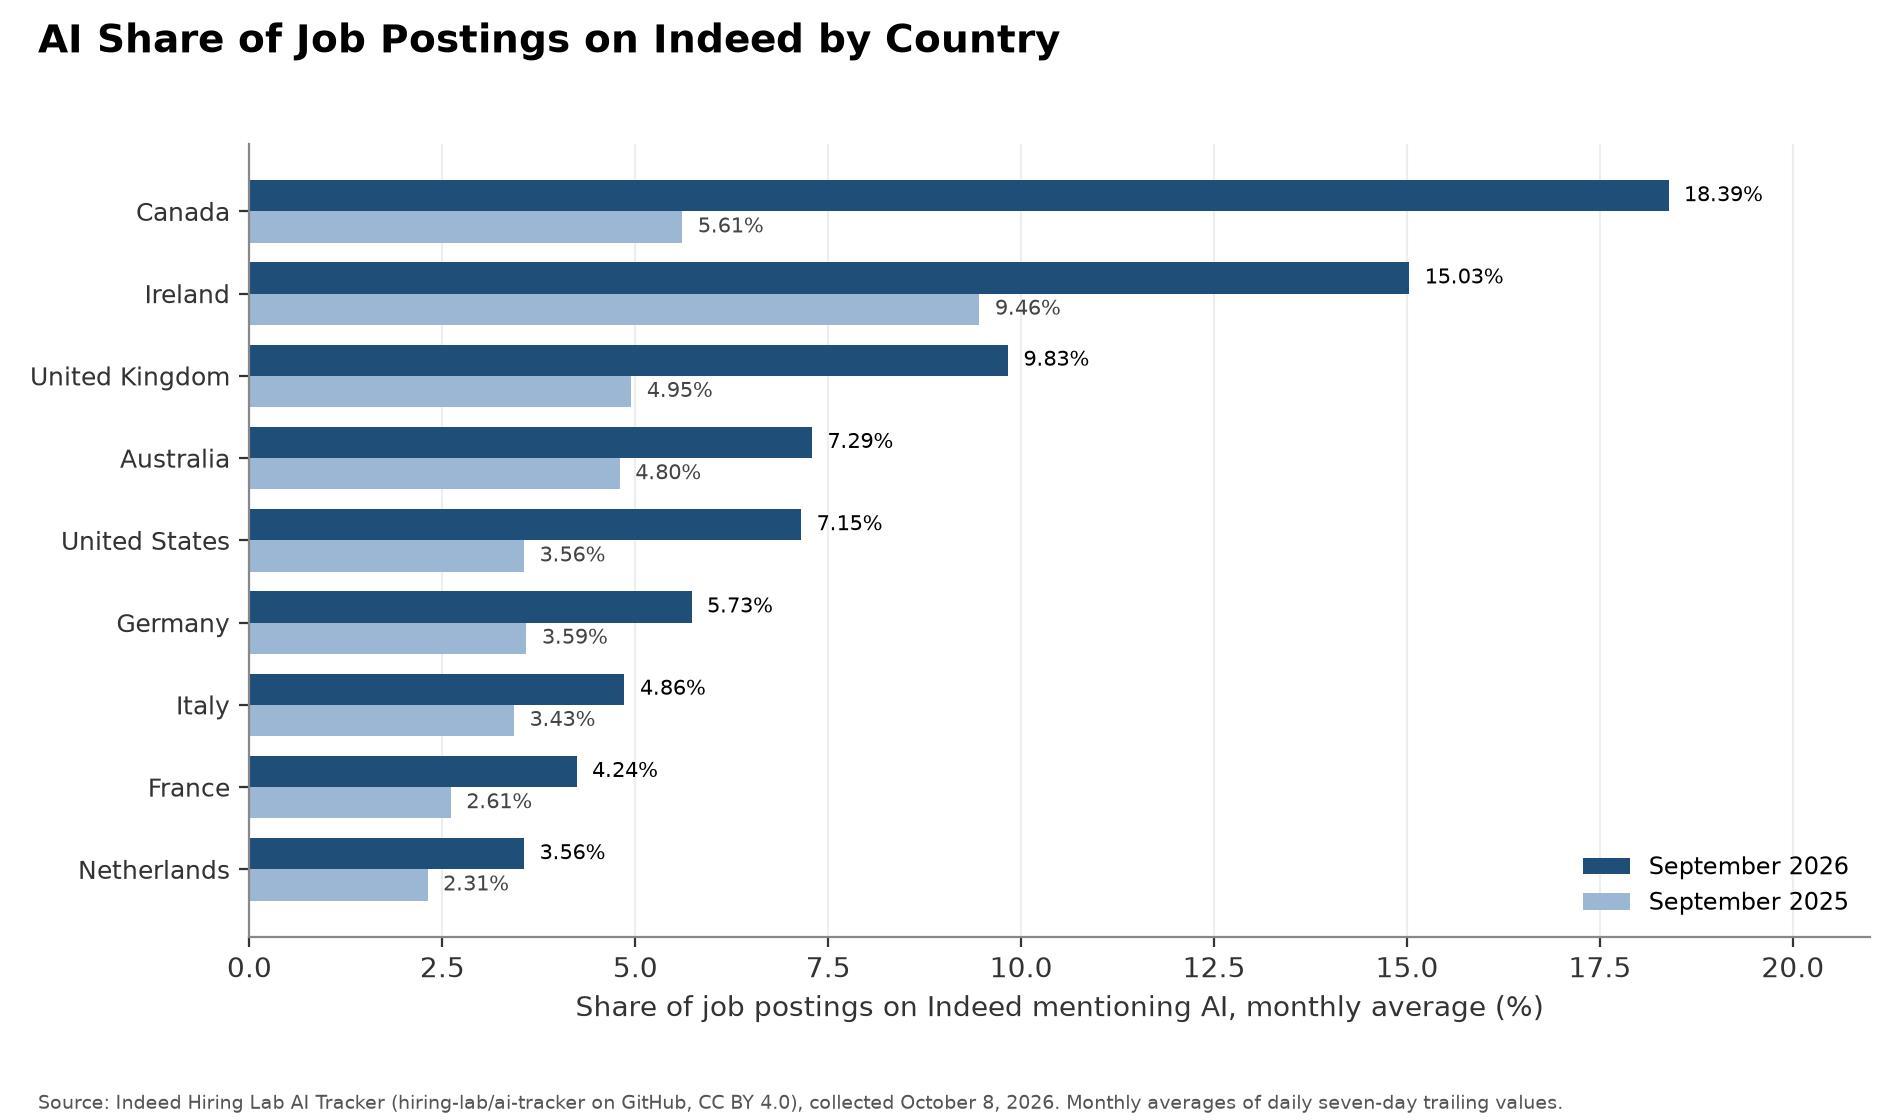
Among the nine countries in Indeed's AI Tracker, the US ranked fifth in September 2026 at 7.15%. Canada had the highest share, 18.39%, up from 5.61% a year earlier, followed by Ireland at 15.03% and the United Kingdom at 9.83%. The Netherlands had the lowest, 3.56%. The share rose in all nine countries over the year.
Share of Job Postings on Indeed Mentioning AI, by Country
| Country | September 2025 | September 2026 | Change (percentage points) |
|---|---|---|---|
| Canada | 5.61% | 18.39% | +12.78 |
| Ireland | 9.46% | 15.03% | +5.57 |
| United Kingdom | 4.95% | 9.83% | +4.88 |
| Australia | 4.80% | 7.29% | +2.49 |
| United States | 3.56% | 7.15% | +3.59 |
| Germany | 3.59% | 5.73% | +2.14 |
| Italy | 3.43% | 4.86% | +1.43 |
| France | 2.61% | 4.24% | +1.63 |
| Netherlands | 2.31% | 3.56% | +1.25 |
Lightcast's 2025 figures, which count postings that require AI skills, put Singapore first at 4.69% of all postings, followed by Hong Kong at 3.48%, Luxembourg at 3.43% and Spain at 3.31%. The US was ninth of the 22 countries and areas shown in the AI Index, at 2.56%, behind Canada at 3.00% and ahead of the United Kingdom at 1.93%. Germany (1.13%), the Netherlands (1.04%) and France (0.99%) were lower.
Lightcast AI Job Postings as a Share of All Postings, 2025
| Rank | Country or area | Share of postings |
|---|---|---|
| 1 | Singapore | 4.69% |
| 2 | Hong Kong | 3.48% |
| 3 | Luxembourg | 3.43% |
| 4 | Spain | 3.31% |
| 5 | Canada | 3.00% |
| 6 | Poland | 2.92% |
| 7 | United Arab Emirates | 2.87% |
| 8 | Sweden | 2.77% |
| 9 | United States | 2.56% |
| 10 | Chile | 2.41% |
| 11 | United Kingdom | 1.93% |
| 12 | Australia | 1.78% |
| 13 | Switzerland | 1.59% |
| 14 | Mexico | 1.38% |
| 15 | Belgium | 1.36% |
| 16 | Italy | 1.33% |
| 17 | Germany | 1.13% |
| 18 | Netherlands | 1.04% |
| 19 | France | 0.99% |
| 20 | Austria | 0.84% |
| 21 | New Zealand | 0.81% |
| 22 | Croatia | 0.38% |
AI Skills in US Job Postings
The AI Industry Reviews research team gathered Lightcast's counts of the AI skills US employers list in postings, which shows job seekers which skills are asked for most.
In Lightcast's 2025 US data, skills in the broad artificial intelligence cluster appeared in 1.70% of all postings and machine learning skills in 0.99%. Generative AI skills appeared in 0.41% and AI agent skills in 0.23%. A posting can list skills from more than one cluster.
US Job Postings Requiring Each AI Skill Cluster, 2025 (Lightcast)
| Skill cluster | Share of all US postings |
|---|---|
| Artificial intelligence | 1.70% |
| Machine learning | 0.99% |
| Generative AI | 0.41% |
| AI agent | 0.23% |
| Natural language processing | 0.22% |
| Neural networks | 0.20% |
| Autonomous driving | 0.14% |
| Visual image recognition | 0.09% |
| Robotics | 0.08% |
| AI ethics, governance and regulations | 0.05% |
Among US postings that required AI skills, 138,188 listed generative artificial intelligence in 2025, up 111% from 65,557 in 2024. Total AI postings grew faster still, so generative AI's share of them slipped from 66.08% to 62.62%. Postings listing agentic AI went from 151 to 16,541, and postings listing AI agents went from 1,310 to 15,217. Retrieval augmented generation, a method that lets language models draw on outside documents, rose 337% to 12,609.
US AI Job Postings Listing Generative AI and AI Agent Skills (Lightcast)
| Skill | 2024 | 2025 | Change |
|---|---|---|---|
| Generative artificial intelligence | 65,557 | 138,188 | +111% |
| Large language modeling | 19,045 | 38,526 | +102% |
| Prompt engineering | 6,152 | 22,227 | +261% |
| Retrieval augmented generation | 2,885 | 12,609 | +337% |
| Agentic AI | 151 | 16,541 | +10,854% |
| AI agents | 1,310 | 15,217 | +1,062% |
| ChatGPT | 5,535 | 14,376 | +160% |
Python was the specialized skill listed most often in US AI postings, in 258,674 of them, followed by computer science (257,127) and scalability (197,744).
Most Common Specialized Skills in US AI Job Postings, 2025 (Lightcast)
| Skill | AI job postings listing the skill |
|---|---|
| Python | 258,674 |
| Computer science | 257,127 |
| Scalability | 197,744 |
| Automation | 190,758 |
| Workflow management | 186,325 |
| Data analysis | 170,396 |
| SQL | 151,191 |
| Project management | 149,865 |
| Data science | 142,120 |
| Amazon Web Services | 142,037 |
AI Job Postings by Industry and State
AI hiring is concentrated in a few industries and states, and the breakdown shows where employers ask for it most.
Lightcast's AI share rose in all 15 industry sectors in the AI Index. The information sector had the highest share in 2025, 13.22%, up from 7.82%. Professional, scientific and technical services followed at 6.49%, then finance and insurance at 5.33% and manufacturing at 4.66%. Management of companies and enterprises more than doubled, from 1.62% to 3.28%, and real estate rose from 1.08% to 2.08%.
AI Job Postings as a Share of All US Postings, by Industry Sector (Lightcast)
| Sector (NAICS) | 2024 | 2025 | Change (percentage points) |
|---|---|---|---|
| Information | 7.82% | 13.22% | +5.40 |
| Professional, scientific and technical services | 4.41% | 6.49% | +2.08 |
| Finance and insurance | 3.27% | 5.33% | +2.06 |
| Manufacturing | 3.35% | 4.66% | +1.31 |
| Management of companies and enterprises | 1.62% | 3.28% | +1.66 |
| Utilities | 2.00% | 2.89% | +0.89 |
| Educational services | 2.03% | 2.42% | +0.39 |
| Real estate and rental and leasing | 1.08% | 2.08% | +1.00 |
| Wholesale trade | 1.06% | 1.93% | +0.87 |
| Mining, quarrying, and oil and gas extraction | 1.74% | 1.87% | +0.13 |
| Public administration | 1.19% | 1.69% | +0.50 |
| Retail trade | 1.04% | 1.67% | +0.63 |
| Agriculture, forestry, fishing and hunting | 0.99% | 1.32% | +0.33 |
| Transportation and warehousing | 0.81% | 1.26% | +0.45 |
| Waste management and administrative support services | 0.35% | 0.46% | +0.11 |
California had 170,881 AI job postings in 2025, 17.18% of the US total, followed by Texas with 80,547 and New York with 66,029. The three states together held 31.92% of US AI postings. Measured against all postings in each place, the AI Index reports Washington, DC, at 6.2% and Delaware at 4.4%.
States With the Most AI Job Postings, 2025 (Lightcast)
| State | AI job postings | Share of US AI job postings |
|---|---|---|
| California | 170,881 | 17.18% |
| Texas | 80,547 | 8.10% |
| New York | 66,029 | 6.64% |
| Illinois | 44,883 | 4.51% |
| Virginia | 41,950 | 4.22% |
| Massachusetts | 39,272 | 3.95% |
| Florida | 39,257 | 3.95% |
| Washington | 39,119 | 3.93% |
| Georgia | 30,415 | 3.06% |
| North Carolina | 29,052 | 2.92% |
US Job Openings
A rising AI share is easier to read next to overall hiring, so government counts of total job openings give the wider picture.
BLS counted 7,079,000 job openings across all nonfarm industries in August 2026, a preliminary figure, against a 2019 monthly average of 7,154,000 and 12,301,000 in March 2022. Openings in the information industry were 123,000 in August 2026, below the 141,000 of August 2025 and the 2019 average. Professional and business services had 1,186,000 openings, up from 1,095,000 a year earlier.
US Job Openings, Thousands, Seasonally Adjusted (BLS JOLTS)
| Series | 2019 monthly average | March 2022 | August 2025 | August 2026 (preliminary) |
|---|---|---|---|---|
| All nonfarm industries | 7,154 | 12,301 | 6,919 | 7,079 |
| Information | 141 | 262 | 141 | 123 |
| Professional and business services | 1,272 | 2,464 | 1,095 | 1,186 |
What AI Job Posting Trends Mean for 2027 and Beyond
More jobs now ask for AI skills, even though the total number of job openings has barely moved. The change is reaching marketing, HR and other office roles, not just tech jobs. Knowing how to use AI tools is starting to be expected rather than a bonus.
If hiring stays flat, AI skills could become a way for employers to choose between candidates for the same number of jobs. Roles that mention AI most are also some of the ones with fewer openings than before the pandemic, so AI skills alone do not guarantee more work. What changes the picture is whether overall hiring picks up again.
So if you are looking for a new job, add the AI tools you use to your resume and be ready to show how you use them in your daily work.
Data Collection and Methodology
Job postings data has a few blind spots, and they affect how far these shares can be read as a count of AI jobs.
Indeed's AI Tracker reports, for each day, the share of job postings on Indeed that contain AI-related keywords such as "machine learning," "data science" and "artificial intelligence," measured as a seven-day trailing average. The series for nine countries comes from Indeed Hiring Lab's public data as of October 8, 2026, covering January 1, 2019, to September 30, 2026, and the monthly and yearly figures are averages of the daily values. Indeed also published a separate generative AI series, based on terms such as "generative AI," "large language models" and "ChatGPT," until it removed that file in August 2025; the generative AI figures come from its last version, which ends June 28, 2025. Occupation shares and counts of AI job titles are as Hiring Lab published them on January 22 and July 8, 2026. Indeed's Job Postings Index sets each occupation's postings on February 1, 2020, at 100, so a reading of 59.1 means postings were at 59.1% of that level.
Lightcast, a labor market data company, counts a posting as an AI job posting when it requires at least one AI skill from its skills list. Its figures for 2024 and 2025 come from the jobs section of the AI Index 2026, published by the Stanford Institute for Human-Centered Artificial Intelligence. Indeed matches keywords in postings while Lightcast classifies the skills a posting requires, so the two give different shares for the same country and year, and they appear in separate tables. Job openings from the Bureau of Labor Statistics (BLS) Job Openings and Labor Turnover Survey give context on overall hiring demand.
Indeed's figures cover postings on Indeed, and Lightcast's cover the postings in its database, so neither counts every job opening. A keyword match shows that a posting mentions AI; it does not show whether the job involves building AI systems or using AI tools. Indeed's AI keywords include "data science," so some data roles count even when the posting mentions no other AI term. Indeed revises past values in its daily series between data releases, and the monthly averages here come from the version available on October 8, 2026. A posting counts once in a share however many AI terms it contains.
Sources
- AI Industry Reviews, AI Job Postings Study: analysis of Indeed Hiring Lab AI Tracker and Job Postings Index data from January 2019 to September 2026, Indeed Hiring Lab research on AI terms by occupation and in job titles, Lightcast data published in the Stanford AI Index 2026, and BLS JOLTS job openings, conducted October 2026.
- Indeed Hiring Lab, AI Tracker data, share of job postings mentioning AI by country, daily, January 1, 2019, to September 30, 2026 (CC BY 4.0). https://github.com/hiring-lab/ai-tracker/blob/bca9fe5176050c03643b86989669778ef671454a/AI_posting.csv
- Indeed Hiring Lab, AI Tracker generative AI series, last published version, ending June 28, 2025 (CC BY 4.0). https://github.com/hiring-lab/ai-tracker/blob/b5ca4d3d0fdacf7d712fb9c88f38f3ba6ee1bc6b/GenAI_posting.csv
- Indeed Hiring Lab, Job Postings Index by occupational sector, United States (CC BY 4.0). https://github.com/hiring-lab/job_postings_tracker/blob/e9811ce6f690de7c22597d7e760f771e56aafedf/US/job_postings_by_sector_US.csv
- Indeed Hiring Lab, Job Postings Index, all US postings (CC BY 4.0). https://github.com/hiring-lab/job_postings_tracker/blob/e9811ce6f690de7c22597d7e760f771e56aafedf/US/aggregate_job_postings_US.csv
- Indeed Hiring Lab, January 2026 US Labor Market Update: Jobs Mentioning AI Are Growing Amid Broader Hiring Weakness, January 22, 2026. https://hiringlab.indeed.com/2026/01/22/january-labor-market-update-jobs-mentioning-ai-are-growing-amid-broader-hiring-weakness/
- Indeed Hiring Lab, AI Is No Longer Just a Tech Occupation Story: It's Spreading Across Job Titles in the US and Europe, July 8, 2026. https://hiringlab.indeed.com/2026/07/08/ai-is-no-longer-just-a-tech-occupation-story/
- Stanford Institute for Human-Centered Artificial Intelligence, AI Index Report 2026, section 4.4 Jobs, Figures 4.4.1 to 4.4.11, data from Lightcast. https://hai.stanford.edu/assets/files/ai_index_report_2026.pdf
- US Bureau of Labor Statistics, Job Openings and Labor Turnover Survey, job openings series JTS000000000000000JOL, JTS510000000000000JOL and JTS540099000000000JOL. https://www.bls.gov/jlt/