
Home / Research / AI Data Center Water Usage Statistics
Market research · October 10, 2026
AI Data Center Water Usage Statistics: 2026 Report
We studied AI data center water usage at six large cloud and data center operators that publish water data: Google, Microsoft, Meta, Amazon Web Services (AWS), Equinix and Digital Realty. Our main measure is water withdrawal, the total water a company takes in during a year from city supplies, groundwater, surface water and reclaimed sources, stated in megaliters (ML, one million liters).
The AI Industry Reviews research team took the figures from each company's latest report as of October 8, 2026: the Google 2026 Environmental Report (2025 data), the Microsoft 2026 Environmental Data Fact Sheet (fiscal year ended June 30, 2025), the Meta 2025 Environmental Data Index (2024 data), the AWS 2025 Sustainability Summary, the Equinix 2025 Sustainability Data Summary and the Digital Realty 2025 Impact Report. Withdrawal is the main measure because it is the only one all six report. Consumption, the water taken in and not returned (withdrawal minus discharge), is shown for the four companies that report both parts. Gallons are converted to liters at 3.785411784 liters per gallon.
Scope differs by company. Google, AWS and Meta report a data center figure. Microsoft reports a company-wide total that includes offices and labs, plus a table of its owned datacenter sites. Equinix and Digital Realty run data centers almost entirely, and their totals are company-wide.
AI Data Center Water Withdrawal by Company
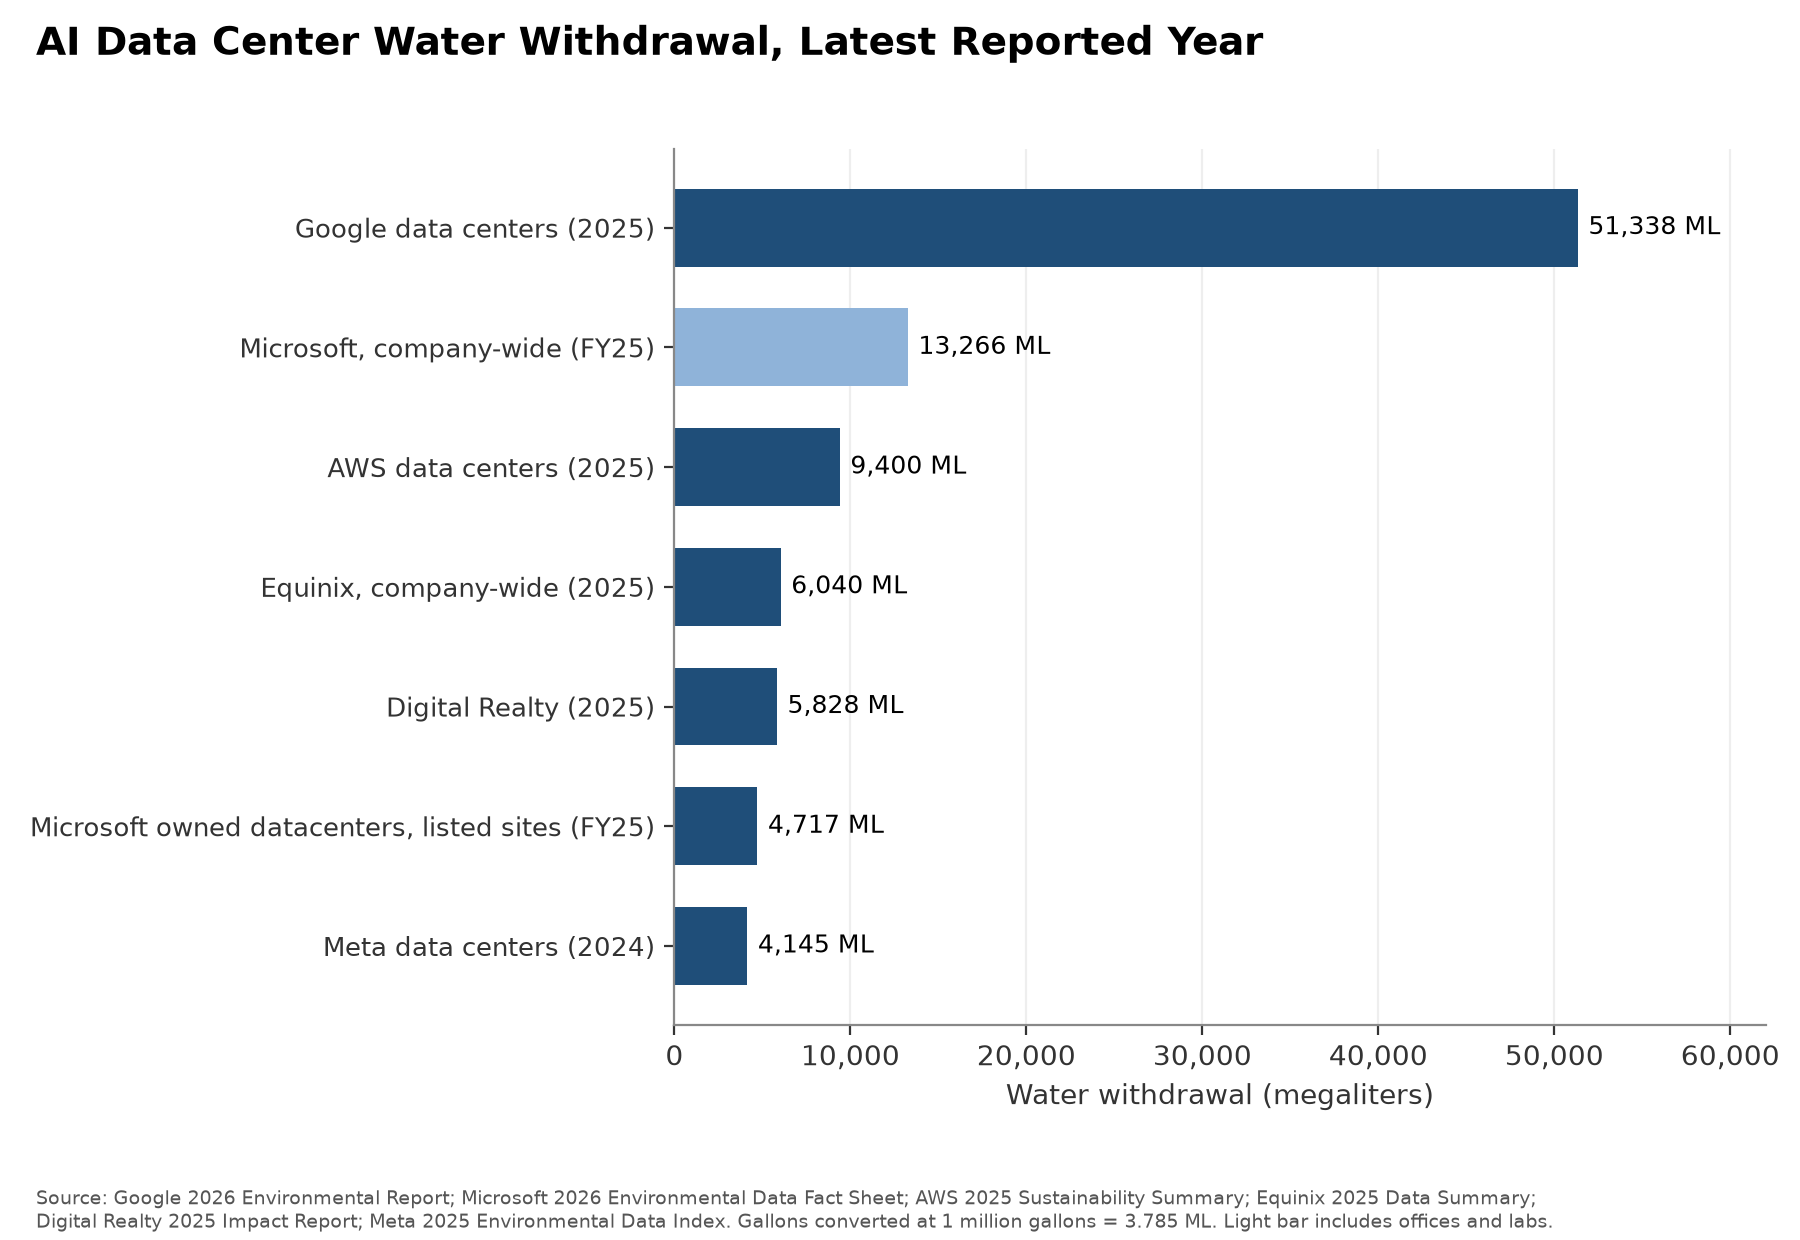
The AI Industry Reviews research team compared how much water each company withdrew from local supplies in its latest reported year, with every figure converted to megaliters.
AI Data Center Water Withdrawal, Latest Reported Year
| Company | Period | Scope | Reported Figure | Withdrawal (ML) |
|---|---|---|---|---|
| 2025 | Data centers | 13,562 million gallons | 51,338 | |
| 2025 | Company-wide | 14,689 million gallons | 55,604 | |
| Microsoft | FY25 (July 2024 to June 2025) | Company-wide (offices, datacenters and labs) | 13,266 ML | 13,266 |
| Microsoft | FY25 | Owned datacenters, 29 listed sites | 4,717 ML (sum of site figures) | 4,717 |
| AWS | 2025 | Leased, owned and shared data centers | 9.4 billion liters | 9,400 |
| Equinix | 2025 | Company-wide | 6,040 ML | 6,040 |
| Digital Realty | 2025 | Managed and operational sites | 1,539,657 thousand gallons | 5,828 |
| Meta | 2024 | Data centers | 4,145 ML | 4,145 |
| Meta | 2024 | Company-wide | 5,637 ML | 5,637 |
- Google's data centers withdrew 51,338 ML in 2025. That is 1.33 times the 38,679 ML reported by the other five companies combined, counting Microsoft's company-wide total and Meta's data center total.
- Data centers made up 92.3% of Google's withdrawal and 73.5% of Meta's.
- Google's Council Bluffs, Iowa, data center withdrew 1,746.4 million gallons (6,611 ML) in 2025, more than Equinix's whole portfolio.
- Quincy, Washington, and Phoenix, Arizona, account for 48.2% of the 4,717 ML withdrawn at Microsoft's listed owned datacenters. Microsoft's site table leaves out locations that together make up less than 1% of the owned total.
- Google drew 80.7% of its data center water from potable supplies (10,949 million gallons). Digital Realty drew 55.5% from potable city water and 44.1% from non-potable city water.
AI Data Center Water Consumption
Some of the water a data center takes in goes back to rivers and treatment plants, and the rest evaporates in cooling or is otherwise not returned. That second part is called consumption, and it is the water a local area does not get back. AWS reports withdrawal only. Digital Realty reports water by source and labels the total as consumption in its assurance statement, but it reports no discharge, so its figure is shown here as withdrawal.
AI Data Center Water Consumption, Latest Reported Year
| Company | Period | Scope | Withdrawal (ML) | Consumption (ML) | Consumption as Share of Withdrawal |
|---|---|---|---|---|---|
| 2025 | Data centers | 51,338 | 39,834 | 77.6% | |
| Equinix | 2025 | Company-wide | 6,040 | 4,600 | 76.2% |
| Meta | 2024 | Data centers | 4,145 | 2,974 | 71.7% |
| Microsoft | FY25 | Company-wide | 13,266 | 8,170 | 61.6% |
| AWS | 2025 | Data centers | 9,400 | Not reported | Not available |
| Digital Realty | 2025 | Managed and operational sites | 5,828 | Not reported | Not available |
- The four companies that report consumption kept between 61.6% and 77.6% of the water they withdrew. The median is 74.0%.
- Google's data centers consumed 10,523 million gallons (39,834 ML) in 2025. Company-wide consumption rose 33.6%, from 8,135 to 10,869 million gallons.
- Google's four largest data center sites by consumption (Council Bluffs, Mayes County in Oklahoma, Berkeley County in South Carolina and New Albany in Ohio) consumed 4,164.8 million gallons, 39.6% of its data center total.
- Microsoft says most of its sites have no discharge meters and that it estimates datacenter withdrawal and consumption from water efficiency metrics, starting in FY24.
AI Data Center Water Withdrawal Over Time
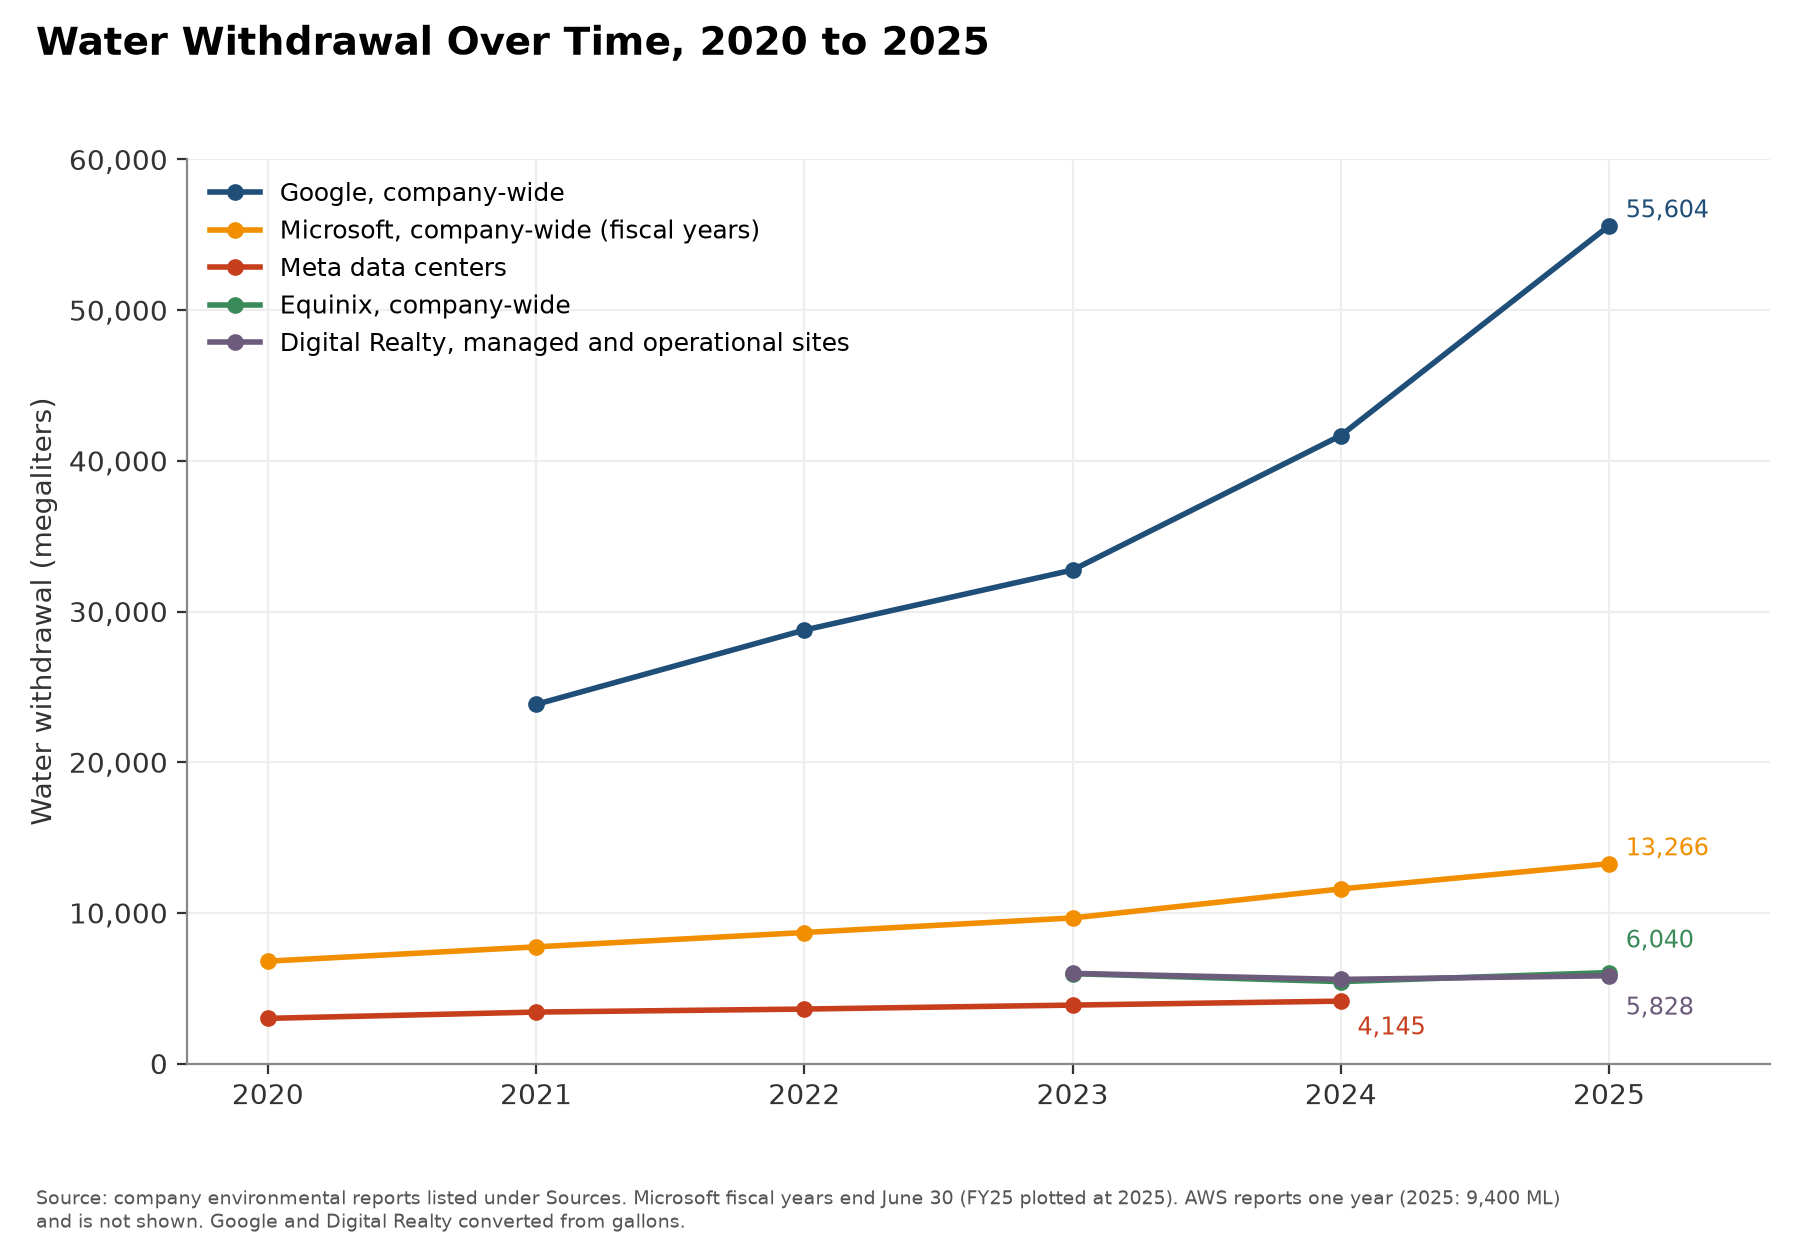
Five companies report more than one year of withdrawal. AWS reports a single year.
AI Data Center Water Withdrawal Trend
| Company | Scope | First Year (ML) | Latest Year (ML) | Change Over Period | Change in Latest Year |
|---|---|---|---|---|---|
| Company-wide | 2021: 23,837 | 2025: 55,604 | +133.3% | +33.4% | |
| Microsoft | Company-wide | FY20: 6,794 | FY25: 13,266 | +95.3% | +14.5% |
| Meta | Data centers | 2020: 3,000 | 2024: 4,145 | +38.2% | +6.8% |
| Equinix | Company-wide | 2023: 5,970 | 2025: 6,040 | +1.2% | +11.0% |
| Digital Realty | Managed and operational sites | 2023: 5,986 | 2025: 5,828 | -2.6% | +4.3% |
- Google's withdrawal grew faster than any other company's in the set, rising by 13,923 ML in 2025 alone. That one-year increase is larger than Microsoft's full FY25 total.
- Microsoft's company-wide withdrawal nearly doubled from FY20 to FY25.
- Digital Realty's report text says its managed portfolio grew 34% from 2023 to 2025 while total water use rose 3%. The appendix table in the same report shows total water 2.6% lower in 2025 than in 2023, so the two figures do not match.
- Meta's 2024 total leaves out another 1,019 ML withdrawn for data center construction, which the company reports in a footnote.
Data Center Water Usage Effectiveness
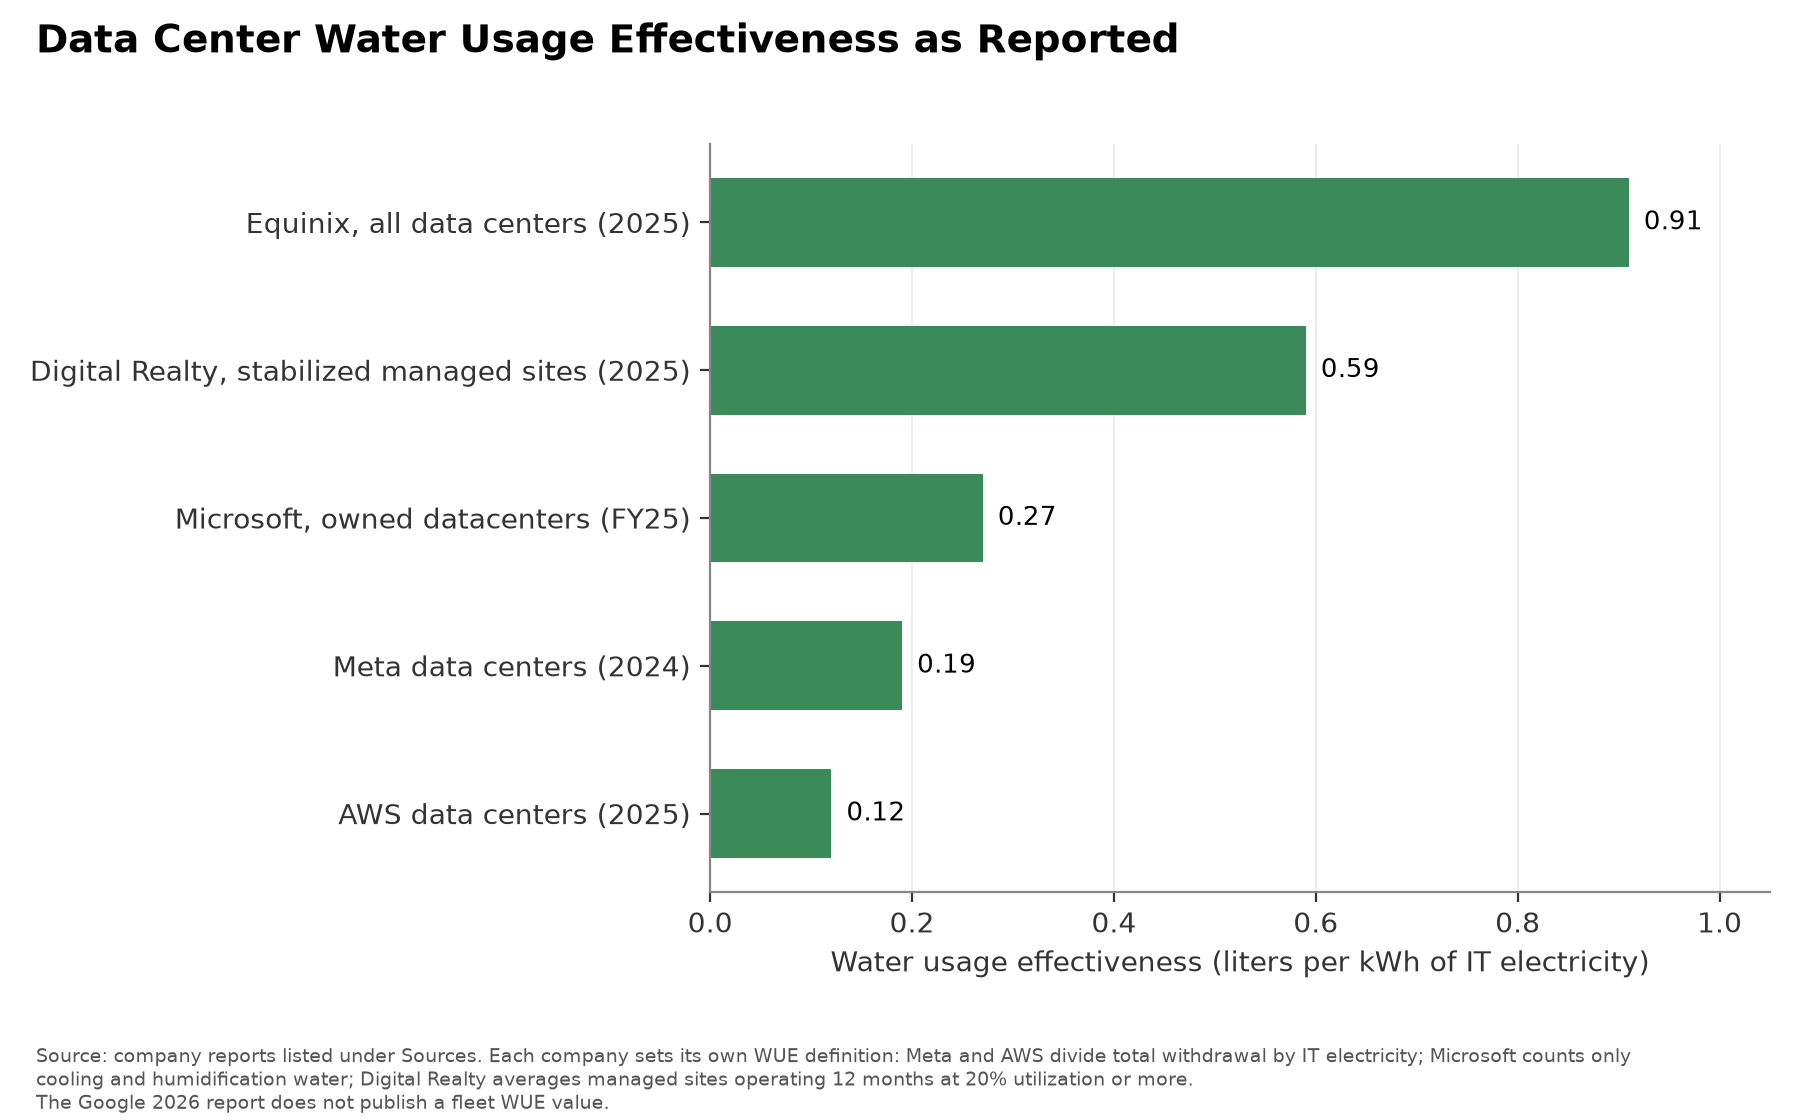
Total water use rises as a company builds more data centers, so operators also report an efficiency figure that shows how much water they use for each unit of electricity their computers draw.
Water usage effectiveness (WUE) is liters of water per kilowatt-hour (kWh) of electricity used by IT equipment. Each company defines the water side differently, so the figures cannot be ranked against each other as equals.
Data Center Water Usage Effectiveness as Reported
| Company | Period | WUE (L/kWh) | Prior Year | Water Counted |
|---|---|---|---|---|
| AWS | 2025 | 0.12 | 0.15 | Total withdrawal |
| Meta | 2024 | 0.19 | 0.18 | Total withdrawal |
| Microsoft | FY25 | 0.27 | 0.30 | Cooling and humidification water at owned datacenters operating 12 months |
| Digital Realty | 2025 | 0.59 | 0.70 | Weighted average of managed sites operating 12 months at 20% utilization or more |
| Equinix | 2025 | 0.91 | 0.95 | Company-defined, entire data center portfolio |
| 2025 | Not published | Not published | Not available |
- AWS cut its WUE from 0.25 in 2021 to 0.12 in 2025, a 52% drop by its own count.
- Meta was the only company whose WUE rose in its latest year, from 0.18 to 0.19.
- Sites that cool with evaporation run far higher: Equinix reports 1.41 for those sites and Digital Realty 1.73. Digital Realty's sites without evaporative cooling averaged 0.07, and it says 25% of its sites use evaporative cooling.
- Microsoft's regional WUE ranged from 0.03 in Europe, the Middle East and Africa to 0.34 in the Americas in FY25.
AI Data Center Water Use in Water-Stressed Areas
Each company also reports how much of its water comes from areas it classes as water-stressed, meaning places where demand for water is high compared with the supply available.
Each company uses its own water-stress screen and cutoff, so the shares below measure different things.
Share of Water From Stressed Areas, Latest Reported Year
| Company | Period | Measure | Share |
|---|---|---|---|
| Microsoft | FY25 | Withdrawal from areas with high or extremely high baseline water stress, company-wide | 50% |
| Digital Realty | 2025 | Water from areas with high or extremely high water stress | 37.6% |
| Equinix | 2025 | Withdrawal from areas with high baseline water stress | 34.9% |
| Meta | 2024 | Withdrawal from areas with high or extremely high baseline water stress, company-wide | 30.2% |
| AWS | 2025 | Withdrawal in high or extremely high water stress regions, leased and owned data centers | 22% |
| 2025 | Freshwater withdrawal from sources at high risk of depletion or scarcity, company-wide | 13% |
- Microsoft withdrew 6,659 ML from areas with high or extremely high baseline water stress in FY25, half of its company-wide withdrawal. Its fact sheet says this water came mainly from third-party suppliers.
- Equinix consumed 1,630 ML in high-stress areas in 2025, 35.4% of its total consumption.
- Google replenished 7,717 million gallons in 2025, which it says equals 78% of its freshwater consumption.
Limits of the AI Data Center Water Usage Data
These figures come from the companies' own reports, and they differ in timing and scope.
Periods differ: Meta's latest public data is for 2024, Microsoft's is for the year ended June 2025, and the rest are for 2025. Microsoft's withdrawal includes offices and labs, its site table covers owned datacenters only, and leased capacity is missing from that table. Equinix and Digital Realty totals are company-wide. AWS does not report consumption, and Digital Realty does not report discharge. Microsoft estimates part of its datacenter figures because most of its sites lack discharge meters. None of the companies splits AI workloads from other computing, so these are fleet totals.
Sources
- AI Industry Reviews, AI Data Center Water Usage Study: analysis of the latest water disclosures from Google, Microsoft, Meta, Amazon Web Services, Equinix and Digital Realty, normalized to water withdrawal in megaliters, conducted October 2026.
- Google, 2026 Environmental Report. https://sustainability.google/files/google-2026-environmental-report.pdf
- Microsoft, 2026 Environmental Data Fact Sheet. https://cdn-dynmedia-1.microsoft.com/is/content/microsoftcorp/microsoft/msc/documents/presentations/CSR/2026-Microsoft-Environmental-Data-Fact-Sheet-PDF.pdf
- Microsoft, Measuring energy and water efficiency for Microsoft datacenters. https://datacenters.microsoft.com/sustainability/efficiency/
- Meta, 2025 Environmental Data Index. https://sustainability.atmeta.com/wp-content/uploads/2025/10/Meta_2025-Environmental-Data-Index.pdf
- Amazon Web Services, 2025 Sustainability Summary. https://sustainability.aboutamazon.com/2025-aws-summary.pdf
- Equinix, 2025 Sustainability Data Summary. https://delivery-p112322-e1154416.adobeaemcloud.com/adobe/assets/deliver/urn:aaid:aem:39ee2b33-ca04-460f-a97b-1e92ef62ec05/Equinix-Inc_2025_Data-Summary.pdf
- Digital Realty, 2025 Impact Report. https://go2.digitalrealty.com/rs/087-YZJ-646/images/Report_Digital_Realty_2605_Impact_Report.pdf