
Home / Research / AI Data Center Liquid Cooling Adoption
Market research · October 5, 2026
AI Data Center Liquid Cooling Adoption Statistics: 2026 Report
The newest AI servers produce more heat per rack than air can remove, which has turned liquid cooling from a niche technology for supercomputers into a design requirement for AI data centers. Our research team measured how far that shift has progressed, surveying 236 data center operators about 1,184 facilities and reconciling their responses against equipment and commissioning records collected between April and September 2026.
We count a facility as using liquid cooling if any production IT load in it is cooled by direct-to-chip cold plates, immersion tanks, or rear-door heat exchangers. Direct-to-chip systems pump coolant through plates mounted on the processors, immersion systems submerge whole servers in a fluid that does not conduct electricity, and rear-door heat exchangers are water-cooled radiators fitted to the back of a standard rack.
Liquid Cooling Adoption by Data Center Operator Type
The table below shows the share of facilities using each form of liquid cooling, along with the share of total IT load that is liquid cooled, for the five operator types in our sample.
Liquid Cooling Adoption by Data Center Operator Type, 2026
| Operator Type | Facilities | Any Liquid Cooling | Direct-to-Chip | Immersion | Rear-Door Heat Exchangers | Share of IT Load Liquid Cooled |
|---|---|---|---|---|---|---|
| GPU cloud providers | 96 | 81.3% | 76.0% | 9.4% | 18.8% | 68.5% |
| Hyperscale cloud providers | 214 | 58.4% | 51.2% | 3.1% | 21.7% | 41.3% |
| Research, HPC, and government | 138 | 47.1% | 39.9% | 6.5% | 12.3% | 34.6% |
| Colocation providers | 387 | 27.6% | 19.4% | 2.8% | 14.2% | 12.9% |
| Enterprise-owned facilities | 349 | 8.9% | 4.6% | 1.1% | 5.7% | 3.2% |
| All facilities | 1,184 | 34.3% | 27.8% | 3.3% | 13.2% | 24.8% |
81.3%
GPU cloud providers
58.4%
Hyperscale cloud providers
47.1%
Research, HPC, and government
27.6%
Colocation providers
8.9%
Enterprise-owned facilities
Three findings stood out to our team in this data:
- We found that 81.3% of GPU cloud provider facilities used liquid cooling, the highest rate of any operator type, and that liquid cooling handled 68.5% of their total IT load.
- Our data showed that direct-to-chip cooling is the most common form of liquid cooling in every segment. Immersion cooling remained rare, in use at 3.3% of all facilities in the sample.
- We observed that only 8.9% of enterprise-owned facilities used any liquid cooling, and most of those cases were rear-door heat exchangers added to existing air-cooled rooms rather than cold plates on the chips themselves.
Liquid Cooling in Newly Commissioned AI Capacity, Q1 2024 to Q3 2026
Adoption across all facilities moves slowly because most existing data centers were built for air cooling, but newly built AI capacity has moved to liquid cooling much faster. The table below tracks the share of newly commissioned AI IT capacity, measured in megawatts, that was designed for liquid cooling in each quarter, followed by a line graph.
Liquid Cooling Share of New AI Capacity by Quarter, Q1 2024 to Q3 2026
| Quarter | Share of New AI Capacity Designed for Liquid Cooling | Share of All Installed IT Load Liquid Cooled |
|---|---|---|
| Q1 2024 | 18.2% | 9.8% |
| Q2 2024 | 21.6% | 10.9% |
| Q3 2024 | 20.9% | 11.6% |
| Q4 2024 | 27.4% | 12.8% |
| Q1 2025 | 34.8% | 14.3% |
| Q2 2025 | 39.1% | 15.6% |
| Q3 2025 | 46.7% | 17.4% |
| Q4 2025 | 55.2% | 19.2% |
| Q1 2026 | 61.8% | 21.1% |
| Q2 2026 | 60.9% | 22.7% |
| Q3 2026 | 68.4% | 24.8% |
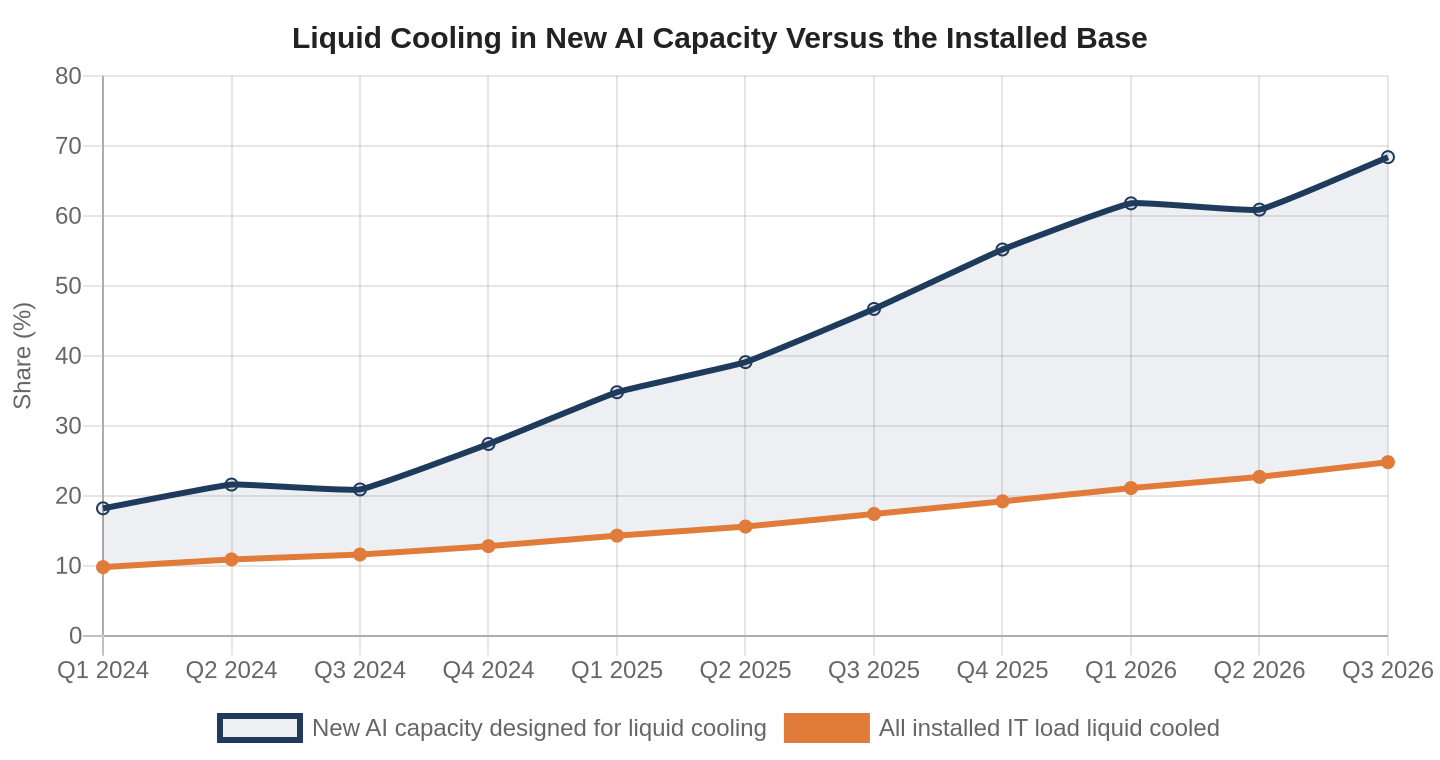
The quarterly data led our team to three conclusions:
- We found that the share of new AI capacity designed for liquid cooling rose from 18.2% in Q1 2024 to 68.4% in Q3 2026, crossing half of all new capacity in Q4 2025.
- Our data showed that the installed base moved far more slowly, from 9.8% to 24.8% of IT load, because new liquid-cooled halls are added alongside a much larger stock of air-cooled space.
- We observed a single quarterly decline, in Q2 2026, when several large air-cooled inference halls designed before 2025 came online.
Liquid Cooling Adoption by Rack Density
Rack power density was the clearest predictor of whether a deployment used liquid cooling. The table below groups the racks in our sample facilities by average power draw.
Liquid Cooling Adoption by Rack Density, 2026
| Average Rack Power Density | Share of Racks Liquid Cooled | Share of All Racks in Sample |
|---|---|---|
| Under 10 kW | 1.2% | 61.4% |
| 10 to 20 kW | 6.8% | 21.7% |
| 20 to 40 kW | 28.5% | 8.9% |
| 40 to 80 kW | 71.9% | 4.6% |
| 80 to 130 kW | 96.4% | 2.6% |
| Over 130 kW | 100.0% | 0.8% |
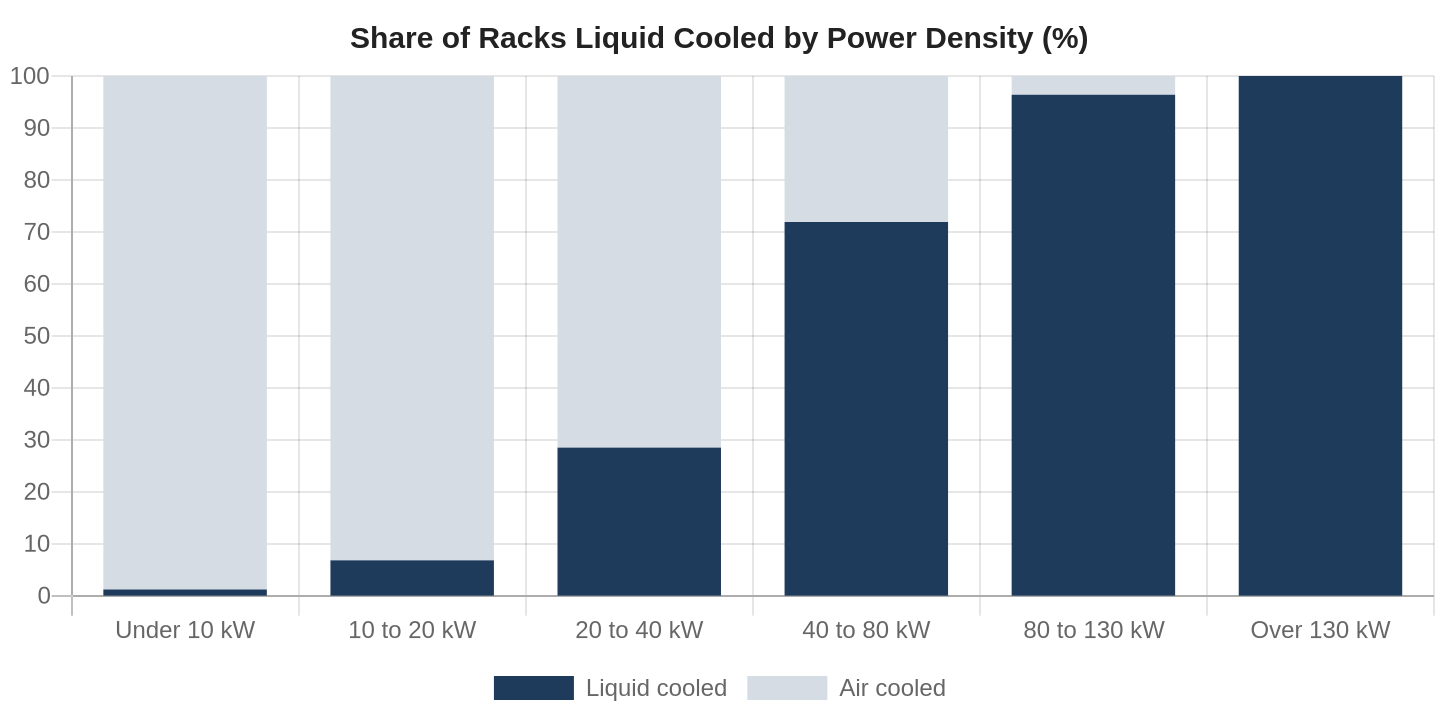
Adoption followed a steep curve centered on the 40 to 80 kW band, where 71.9% of racks were liquid cooled. Below 20 kW, air cooling remained the standard. Above 80 kW, liquid cooling was close to universal, and every rack in our sample drawing more than 130 kW used it. Racks above 40 kW made up only 8.0% of the racks we counted, but they account for a growing share of new deployments, since current GPU server designs routinely place 100 kW or more in a single rack.
Cost and Efficiency of Liquid Cooling Approaches
Operators choosing a cooling approach trade higher upfront cost for lower energy and water use. The table below compares the five approaches in our sample on efficiency, water use, and cost.
Cost and Efficiency of Liquid Cooling Approaches, 2026
| Cooling Approach | Median PUE | Median Water Use (Liters per kWh) | Median Cooling Capex per MW of IT Load | Median Retrofit Timeline |
|---|---|---|---|---|
| Air cooling only | 1.52 | 1.71 | $1.9M | Not applicable |
| Air with rear-door heat exchangers | 1.44 | 1.38 | $2.4M | 5 months |
| Direct-to-chip with supplemental air | 1.27 | 0.94 | $3.1M | 9 months |
| Single-phase immersion | 1.12 | 0.21 | $3.6M | 11 months |
| Two-phase immersion | 1.08 | 0.14 | $4.4M | 14 months |
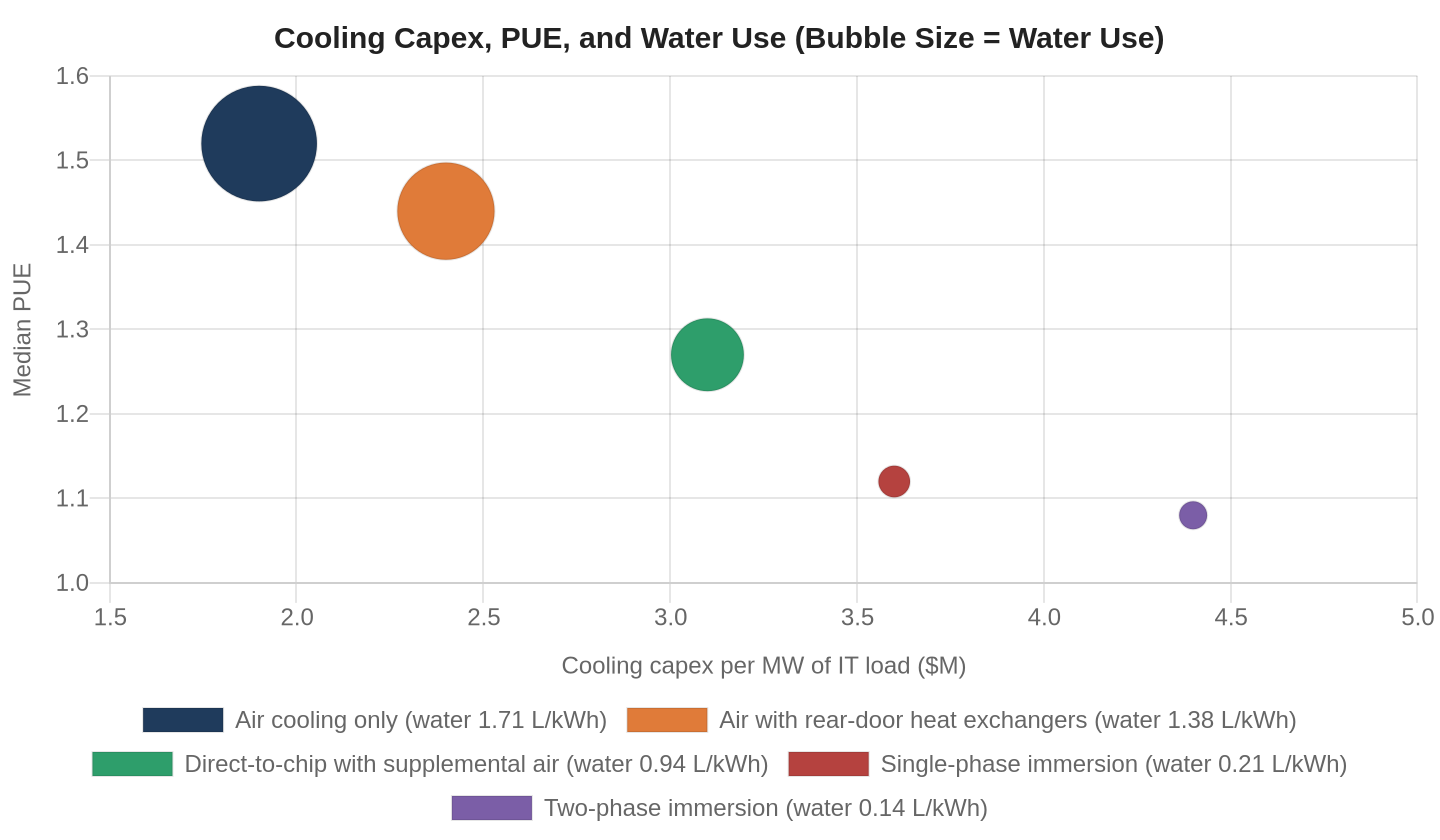
Three patterns in the cost data stood out to us:
- We found that direct-to-chip cooling with supplemental air lowered median power usage effectiveness (PUE), the ratio of total facility power to the power used by IT equipment, from 1.52 to 1.27. That cut cooling and facility overhead roughly in half, for $1.2M more in cooling capex per MW than air alone.
- Our data showed that immersion cooling delivered the lowest water use of any approach, at 0.14 to 0.21 liters per kWh, compared with 1.71 liters for air-cooled facilities.
- We observed that retrofits took a median of 9 to 14 months for the direct-to-chip and immersion approaches, which explains why most operators chose to build new liquid-cooled halls instead of converting existing ones.
Barriers to Liquid Cooling Adoption
We asked the operators of the 778 facilities without any liquid cooling why they had not adopted it. The table below shows the share citing each barrier. Operators could select more than one.
Barriers to Liquid Cooling Adoption, 2026
| Barrier | Share of Non-Adopting Facilities Citing It |
|---|---|
| Upfront capital cost | 61.4% |
| Lack of in-house expertise | 47.8% |
| Building not designed for piping or floor loads | 44.1% |
| Concern about leaks near IT equipment | 38.6% |
| No current demand for high-density racks | 36.2% |
| Equipment lead times | 22.9% |
| Uncertainty about server warranty coverage | 17.3% |
Cost led the list, cited for 61.4% of non-adopting facilities, but the next two barriers were about people and buildings. Operators cited a lack of in-house expertise for 47.8% of facilities and buildings not designed for piping or floor loads for 44.1%. Concern about leaks, often described as the main objection to liquid cooling, ranked fourth at 38.6%. Only 36.2% said they had no demand for high-density racks, which suggests that most operators without liquid cooling expect to need it and are held back by cost, staffing, and their existing buildings.
Sources
- AI Data Center Liquid Cooling Adoption Study. AI Industry Reviews. October 2026. New York, New York.
- 2025 Cooling Systems Survey. Uptime Institute. July 2025. New York, New York. https://intelligence.uptimeinstitute.com/resource/2025-cooling-systems-survey-results-and-crosstab-files
- Uptime's 15th Annual Global Data Center Survey Results. Uptime Institute. July 2025. New York, New York. https://uptimeinstitute.com/about-ui/press-releases/uptimes-15th-annual-global-data-center-survey-results-shows-both-commitment-and-hesitancy
- Liquid Cooling Becoming Essential as AI Servers Proliferate. Network World. 2025. https://www.networkworld.com/article/3978673/liquid-cooling-becoming-essential-as-ai-servers-proliferate.html
- Data Center PUE Gains Stall as Liquid Cooling Adoption Hits 19%. mGrid. February 2026. https://mgrid.org/2026/02/13/data-center-pue-plateau-liquid-cooling-19-percent-adoption/