
Home / Research / AI Data Center Carbon Emissions Statistics
AI Data Center Carbon Emissions Statistics: 2026 Report
 By Darin ten Bruggencate, Founder, AI Industry Reviews · November 21, 2026
Our analysts compared the IEA's April 2025 Energy and AI report and its April 16, 2026 Key Questions on Energy and AI report with greenhouse-gas tables in Google's 2026 Environmental Report, Microsoft's 2026 Environmental Data Fact Sheet, and Meta's 2025 Environmental Data Index, all opened on November 13, 2026. We set out the IEA's published data-center emissions and electricity figures, then the US companies' Scope 2 totals, then published estimates for a single training run. We calculated year-to-year changes and shares only from the published totals. The company figures are company-wide Scope 2 unless a source isolated data centers, as Meta did.
Key Findings
- The IEA put indirect CO2 from data-center electricity at about 180 million tonnes, or 0.5% of global fuel-combustion emissions, in its April 2025 report.
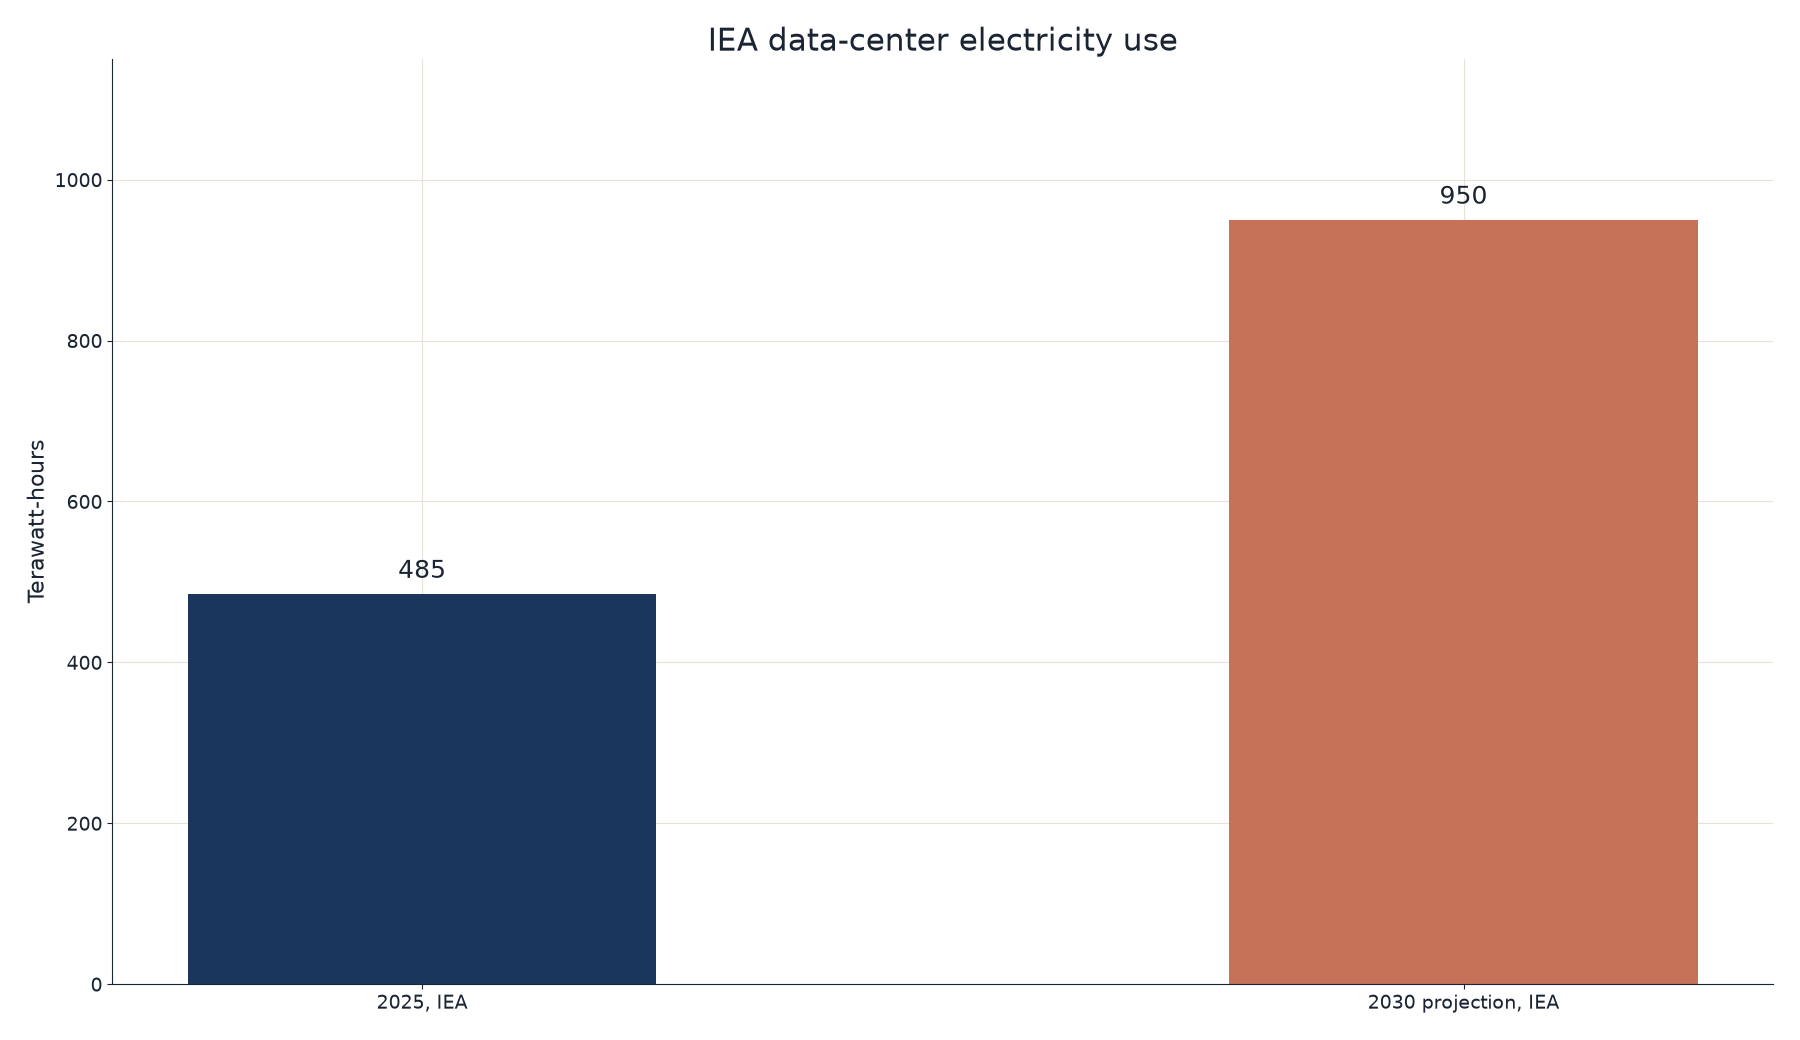
- Data-center electricity use reached 485 terawatt-hours in 2025, up 17%, and electricity use at AI-focused data centers rose 50%.
- The IEA expects data-center emissions to reach around 350 million tonnes in 2035, about 2% of global electricity-sector emissions.
- Google's location-based Scope 2 emissions rose 36.9% in 2025, to 15,148,700 tonnes, while its market-based total fell 2.9%, to 2,815,000 tonnes.
- Microsoft's market-based Scope 2 total rose from 259,090 tonnes to 2,707,428 tonnes in the fiscal year ended June 30, 2025.
Training and running AI models takes electricity, and most of that electricity is generated in a way that still produces carbon dioxide. The greenhouse-gas question is therefore a step beyond how much power a data center uses, how much water it withdraws, or what nearby households pay for electricity. It asks how many tons of CO2 are tied to that electricity, and whether the figure is a grid average or a residual after a company buys renewable energy certificates and power purchase agreements. Those two accounting methods, called location-based and market-based, can differ by an order of magnitude for the same company. We kept the International Energy Agency's global totals separate from company disclosures, and location-based and market-based figures on different lines, so each number can be cited with its method.
In the following sections, we set out the IEA's global data-center emissions and electricity figures, compare location-based and market-based Scope 2 totals at Google, Microsoft, and Meta, and report published carbon estimates for training Grok 4.
How Large Are Global Data Center Emissions?
We started with the IEA's figures because the agency publishes a global data-center emissions total with a stated scope. Its April 2025 figure covers indirect emissions from electricity use at all data centers, including AI, and excludes backup generation. Its April 2026 report updated electricity use and the 2035 emissions outlook.
IEA published figures for data-center electricity and CO2
| Measure | Figure | Report and date | Scope notes |
|---|---|---|---|
| Indirect CO2 from data-center electricity | About 180 million tonnes | Energy and AI, April 2025 | All data-center workloads, of which AI is a subset; excludes backup generation; 0.5% of 35,000 million tonnes of global fuel-combustion CO2 in 2024 |
| Base Case share of combustion emissions later in the decade | About 1% | Energy and AI, April 2025 | Indirect emissions grow by almost 80% over the decade |
| Lift-Off Case share of combustion emissions | 1.4% | Energy and AI, April 2025 | 2.5 times the "today" level in that report |
| Data-center electricity use | 485 TWh | Key Questions on Energy and AI, April 16, 2026 | 2025; up 17%, against 3% growth in global electricity demand |
| AI-focused data-center electricity use | Up 50% in 2025 | Key Questions on Energy and AI, April 16, 2026 | 2025, year-over-year change |
| Data-center electricity use, 2030 projection | 950 TWh | Key Questions on Energy and AI, April 16, 2026 | About double 2025, and about 3% of global electricity demand |
| Data-center emissions, 2035 | Around 350 million tonnes | Key Questions on Energy and AI, April 16, 2026 | About double the earlier level, and about 2% of global electricity-sector emissions |
Key Findings
- The 180 million tonne figure and the 350 million tonne figure come from two IEA reports published a year apart, so they are separate estimates. The later report covers 2025 electricity use and the 2035 emissions outlook.
- The IEA also estimated that wider use of existing AI applications in energy, industry, transport, and buildings could avoid 1,400 million tonnes of CO2 in 2035 in a Widespread Adoption Case. The IEA added that current momentum does not yet lock in that outcome.
- Data centers are a small share of global CO2 and one of the sectors whose emissions are still rising. The 180 million tonne figure covers all data-center workloads, of which AI is a subset.
How Do US Companies Report the Emissions Behind Their Electricity Use?
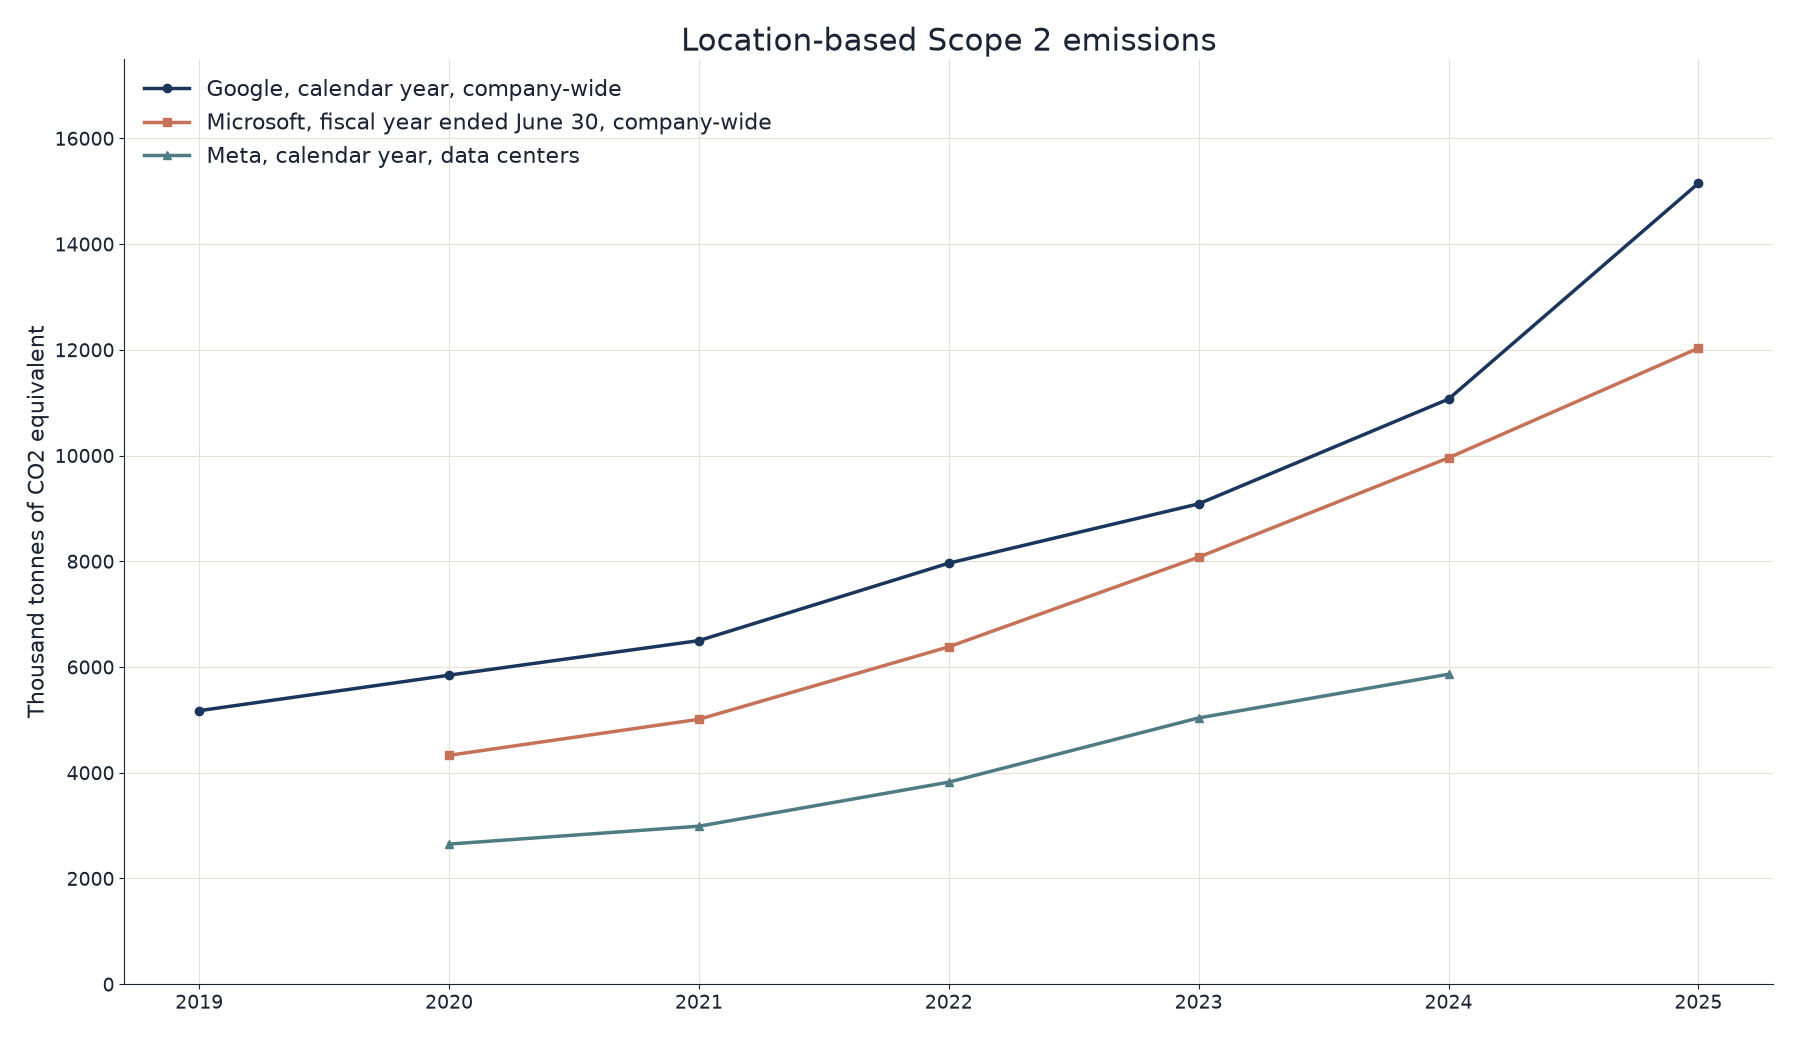
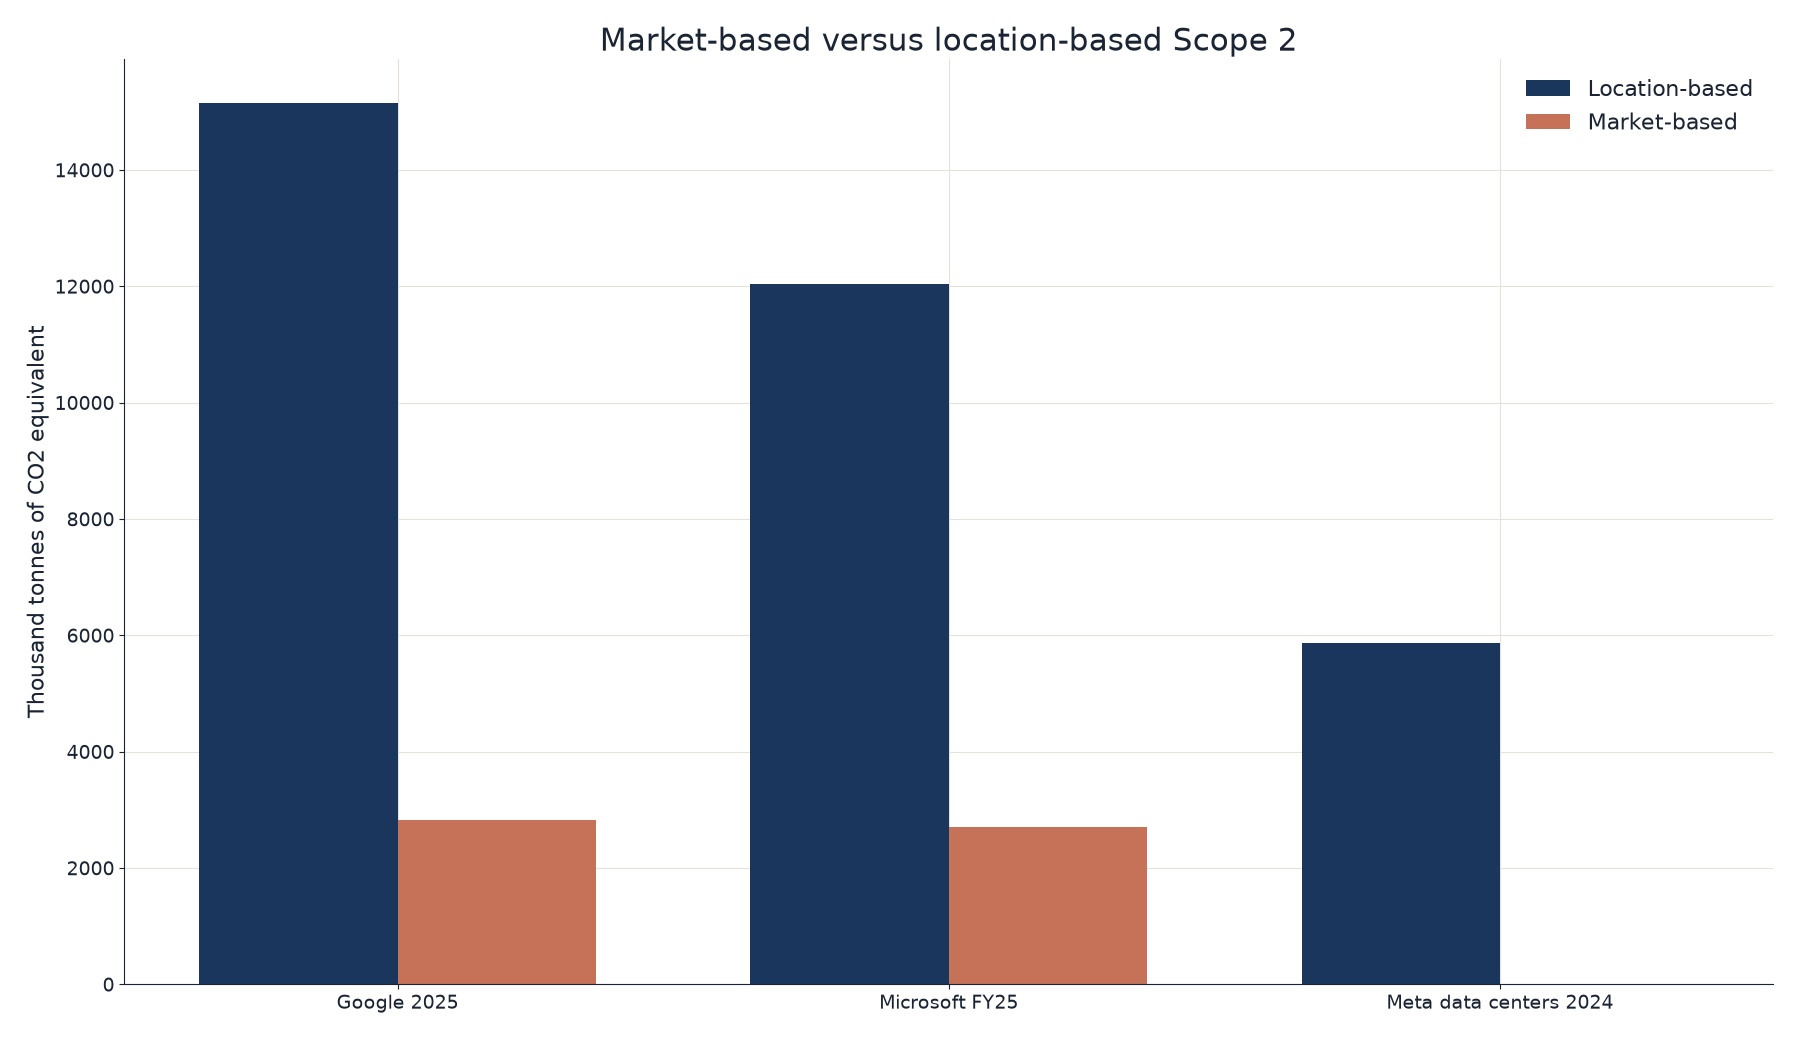
We then compared the three largest US cloud and AI spenders that publish both Scope 2 methods. Scope 2 is the greenhouse-gas category for purchased electricity. Location-based Scope 2 uses average emissions on the grids where the electricity is consumed. Market-based Scope 2 reflects contractual instruments such as power purchase agreements and energy certificates. Google and Microsoft publish both, as company-wide totals. Meta also publishes a data-center-only breakout through 2024.
Google Scope 2 greenhouse-gas emissions, calendar years 2019 to 2025
| Year | Location-based Scope 2 (tCO2e) | Market-based Scope 2 (tCO2e) |
|---|---|---|
| 2019 | 5,173,000 | 788,200 |
| 2020 | 5,845,000 | 921,200 |
| 2021 | 6,498,700 | 1,769,400 |
| 2022 | 7,963,700 | 2,430,200 |
| 2023 | 9,085,700 | 3,288,000 |
| 2024 | 11,067,100 | 2,898,600 |
| 2025 | 15,148,700 | 2,815,000 |
Microsoft Scope 2 greenhouse-gas emissions, fiscal years ended June 30, 2020 to 2025
| Fiscal year | Location-based Scope 2 (tCO2e) | Market-based Scope 2 (tCO2e) |
|---|---|---|
| FY20 | 4,328,916 | 456,119 |
| FY21 | 5,010,667 | 429,405 |
| FY22 | 6,381,250 | 288,029 |
| FY23 | 8,077,403 | 393,134 |
| FY24 | 9,955,368 | 259,090 |
| FY25 | 12,030,556 | 2,707,428 |
Meta data-center Scope 2 greenhouse-gas emissions, calendar years 2020 to 2024
| Year | Location-based, data centers (tCO2e) | Market-based, data centers (tCO2e) |
|---|---|---|
| 2020 | 2,650,000 | 2,000 |
| 2021 | 2,987,964 | 2,487 |
| 2022 | 3,821,450 | 273 |
| 2023 | 5,036,131 | 733 |
| 2024 | 5,862,614 | 135 |
Key Findings
- Google's location-based Scope 2 total rose 36.9% in 2025, to 15,148,700 tonnes, while its market-based total fell 2.9%, to 2,815,000 tonnes. Electricity purchased for data centers and offices is the main source of Google's Scope 2 emissions.
- Microsoft's location-based Scope 2 total rose 20.8% in fiscal year 2025, to 12,030,556 tonnes. Its market-based total rose from 259,090 tonnes to 2,707,428 tonnes, a much larger relative increase, after several years in which the market-based figure had stayed below 500,000 tonnes.
- Meta's data-center location-based total reached 5,862,614 tonnes in 2024, while its data-center market-based total was 135 tonnes. For all facilities, Meta reported 5,967,348 tonnes location-based and 1,358 tonnes market-based in 2024. Meta's 2025 index stops at calendar year 2024.
Key Findings
- Any figure cited as a company's "data center emissions" needs its method stated. A market-based total can be a small fraction of the location-based total, as it is at Meta, or it can rise sharply in a single year, as it did at Microsoft in fiscal year 2025, when contractual instruments no longer offset as much of the underlying electricity use.
How Much Carbon Is Attributed to a Single Training Run?
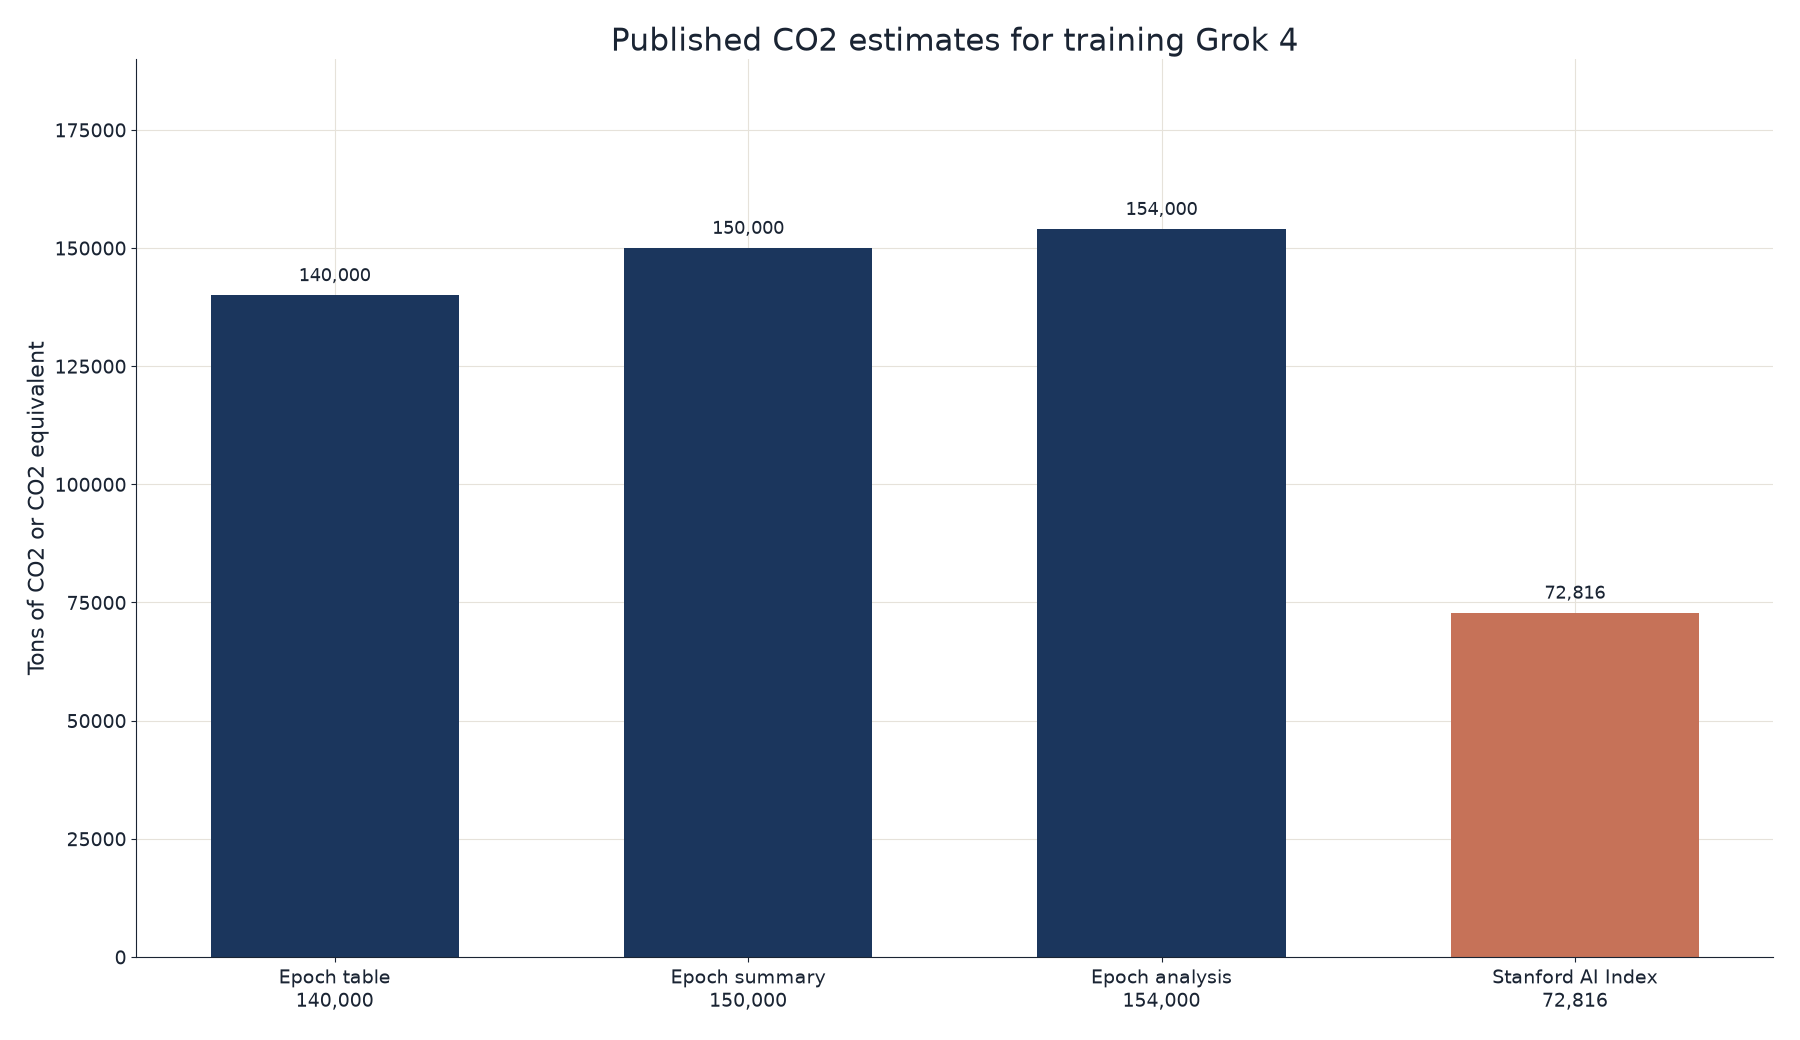
Company Scope 2 totals mix training, inference, and non-AI work. A few published estimates try to isolate one training run. The most detailed recent example is Epoch AI's September 12, 2025 note on Grok 4, which was trained at xAI's Memphis Colossus facility, powered largely by natural gas. Stanford's 2026 AI Index later published a different Grok 4 training-emissions figure, using its own method.
Published CO2 estimates for training Grok 4
| Source | Date | Estimate | Method, as published |
|---|---|---|---|
| Epoch AI data insight, table | September 12, 2025 | 140,000 tons CO2 | Table on the page |
| Epoch AI data insight, summary sentence | September 12, 2025 | 150,000 tons CO2 | Same page, summary sentence |
| Epoch AI data insight, analysis | September 12, 2025 | 154,000 tons CO2 | 310 GWh times 0.49 kilograms CO2-equivalent per kilowatt-hour for natural gas |
| Stanford HAI, 2026 AI Index, as reported in the April 13, 2026 takeaways article | April 13, 2026 | 72,816 tons CO2 equivalent | Method not fully specified in the takeaways article |
Key Findings
- The three Epoch figures come from one analysis, shown at different points on the same page. The 154,000-ton calculation is the one Epoch shows with an explicit emissions factor. The spread between Epoch's range and the AI Index's 72,816 tonnes is large enough that the two should not be averaged.
- Epoch's energy total for the same run is 310 GWh, which is also the starting point for the 154,000-ton calculation. A cleaner assumed grid would produce a lower carbon total from the same electricity use, which is one reason two careful estimates can disagree.
- A single-run carbon figure in a model card or a procurement disclosure is only as useful as its electricity total and its emissions factor. It cannot be added to a company's Scope 2 inventory without double-counting, and it cannot stand in for the emissions of serving the model after training.
What These Emissions Figures Mean for AI's Climate Footprint
The global totals remain small as a share of world CO2 and large as a source of new emissions. Electricity use at data centers, and faster still at AI-focused sites, is rising quickly enough that the IEA now sees data-center emissions around 350 million tonnes in 2035. US company reports show why the choice of accounting method matters: location-based totals have climbed with electricity use at Google, Microsoft, and Meta, while market-based totals have moved in different directions, including a sharp rise at Microsoft in fiscal year 2025.
A training-run estimate, even a carefully documented one, answers a narrower question. It can show that a single frontier run is already measured in tens or hundreds of thousands of tons of CO2, and it cannot describe the continuing emissions from inference, which are part of the company and IEA totals above.
So if you are citing data-center carbon emissions from AI, say whether the figure is a global IEA total for all data-center workloads, a company's location-based or market-based Scope 2 number, or an estimate for one training run, and give the report and the year.
Methodology
Scope. This report covers published greenhouse-gas figures tied to data-center electricity use and, where a source isolates it, to AI training. It does not restate AIR's separate reports on data-center electricity prices, water use, or power capacity, except where an emissions source also publishes an electricity total. All mass figures are in metric tons or million tonnes, as published. Microsoft's fact sheet labels the unit mtCO2e, treated here as metric tons of CO2 equivalent. The three company series are not added together, because their periods and organizational scopes differ, and because Google and Microsoft figures are company-wide Scope 2.
Sources and dates. The IEA pages, the Google, Microsoft, and Meta reports, the Epoch Grok 4 note, and the Stanford AI Index takeaways article were retrieved on November 13, 2026. Google's report covers calendar years through 2025. Microsoft's fact sheet covers fiscal years ended June 30 through FY25. Meta's 2025 index, dated October 2025, covers calendar years through 2024 and includes a data-center breakout.
Calculations. Google's 2025 location-based increase is (15,148,700 - 11,067,100) / 11,067,100 = 36.9%, rounded once. Its market-based change is (2,815,000 - 2,898,600) / 2,898,600 = -2.9%, rounded once. Microsoft's location-based increase in FY25 is (12,030,556 - 9,955,368) / 9,955,368 = 20.8%, rounded once. The IEA's 180 million tonne emissions figure and its later 17% electricity increase come from different reports and are not combined into a 2025 emissions total.
Grok 4. All three CO2 figures on Epoch's September 12, 2025 page are reported, plus the AI Index figure, and they are not combined. Epoch's 154,000-ton analysis uses 310 GWh and 0.49 kilograms per kilowatt-hour; 310 million kWh times 0.49 kilograms is 151,900 tons, which Epoch reports as 154,000 tons, so 154,000 is treated as Epoch's published result.
Sources
- AI Industry Reviews, AI Data Center Carbon Emissions Statistics: 2026 Report, comparison of IEA, Google, Microsoft, Meta, Epoch AI, and Stanford HAI published figures, conducted November 2026 (this study).
- International Energy Agency, Energy and AI, chapter on AI and climate change, April 2025: https://www.iea.org/reports/energy-and-ai/ai-and-climate-change
- International Energy Agency, Key Questions on Energy and AI, executive summary, April 16, 2026: https://www.iea.org/reports/key-questions-on-energy-and-ai/executive-summary
- International Energy Agency, Data centre electricity use surged in 2025, even with tightening bottlenecks driving a scramble for solutions, press release, April 16, 2026: https://www.iea.org/news/data-centre-electricity-use-surged-in-2025-even-with-tightening-bottlenecks-driving-a-scramble-for-solutions
- Google, 2026 Environmental Report, environmental metrics data tables, opened November 13, 2026: https://sustainability.google/files/google-2026-environmental-report/
- Microsoft, 2026 Environmental Data Fact Sheet, Table 1A, fiscal year ended June 30, 2025, opened November 13, 2026: https://cdn-dynmedia-1.microsoft.com/is/content/microsoftcorp/microsoft/msc/documents/presentations/CSR/2026-Microsoft-Environmental-Data-Fact-Sheet-PDF.pdf
- Meta, 2025 Environmental Data Index, Scope 2 data-center and facilities tables through 2024, opened November 13, 2026: https://sustainability.atmeta.com/wp-content/uploads/2025/10/Meta_2025-Environmental-Data-Index.pdf
- Epoch AI, What did it take to train Grok 4?, James Sanders, Luke Emberson, and Yafah Edelman, September 12, 2025: https://epoch.ai/data-insights/grok-4-training-resources
- Stanford Institute for Human-Centered AI, Inside the AI Index: 12 Takeaways from the 2026 Report, Shana Lynch, April 13, 2026: https://hai.stanford.edu/news/inside-the-ai-index-12-takeaways-from-the-2026-report