
Home / Research / AI Compute Spend as % of Revenue
Market research · October 2, 2026
AI Compute Spend as a Percentage of Revenue Statistics: 2026 Report
For companies building on AI, compute has become one of the largest lines in the budget, and the question finance teams ask most often is how much is normal. Our research team answered it by collecting compute spending and revenue data from 318 companies, from foundation model developers to non-technology enterprises, for the trailing twelve months ending September 30, 2026.
We define compute spend as all spending on GPU cloud capacity, reserved and owned AI hardware (counted as depreciation), and third-party model API fees, for both training and inference, wherever it falls in the income statement. The sections below give the ratio of that spend to revenue by company type, revenue stage, quarter, spend destination, and growth rate.
AI Compute Spend as a Percentage of Revenue by Company Type
The table below answers the central question of this report: what share of revenue each type of company spends on AI compute, along with the typical range and the share of that spend that went to model training.
The AI Compute Spend as a Percentage of Revenue by Company Type, 2026
| Company Type | Companies | Median Compute Spend as % of Revenue | Interquartile Range | Share of Compute Spend on Training |
|---|---|---|---|---|
| Foundation model developers | 21 | 142.0% | 88.0% to 231.0% | 63.4% |
| Inference and GPU cloud platforms | 27 | 58.4% | 44.1% to 71.6% | 8.7% |
| AI application and agent startups | 112 | 26.7% | 17.9% to 38.2% | 21.8% |
| AI developer tools and infrastructure software startups | 41 | 14.3% | 9.6% to 21.5% | 30.9% |
| Public software companies with AI features | 54 | 6.8% | 4.1% to 9.7% | 17.5% |
| Non-technology enterprises | 63 | 0.9% | 0.4% to 1.6% | 11.6% |
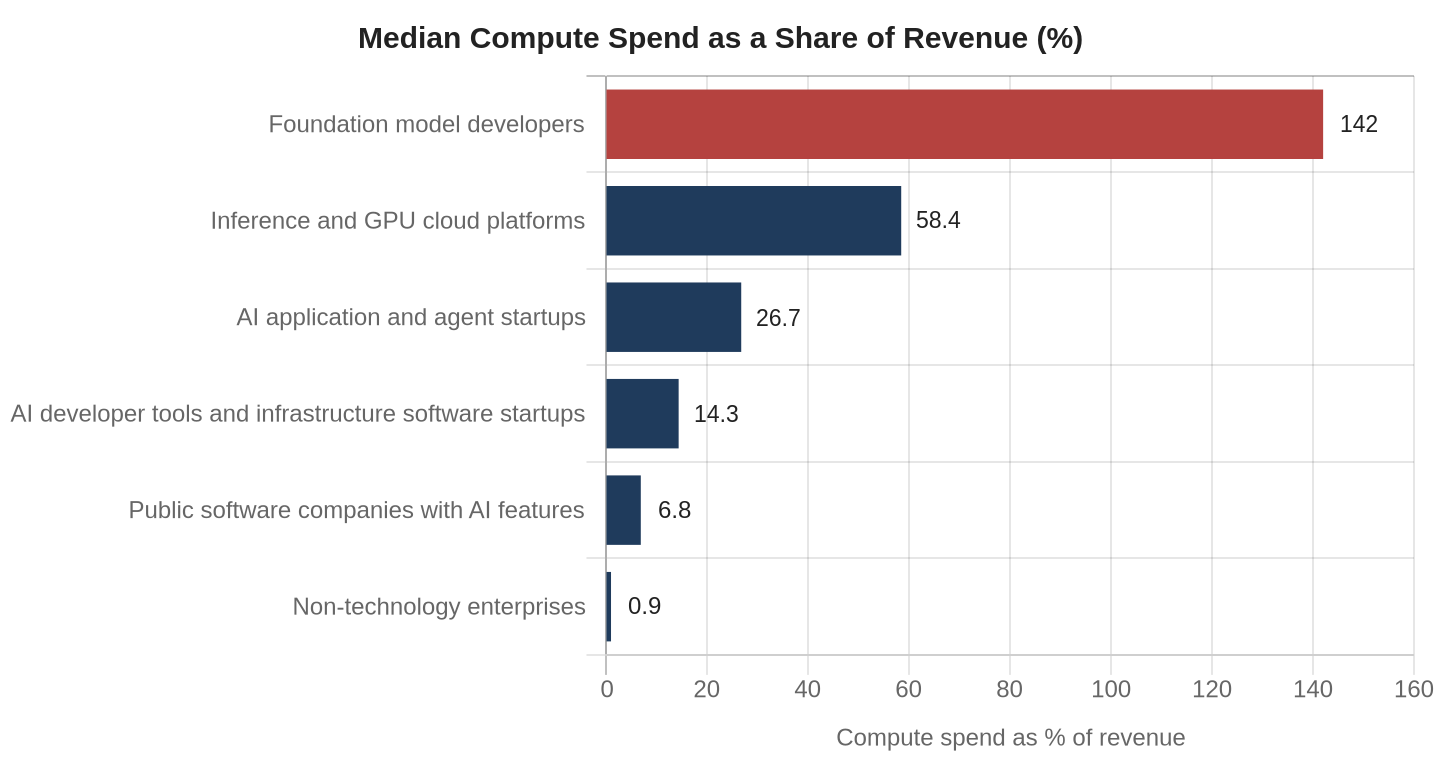
Three findings stood out in this data:
- The median foundation model developer spent $1.42 on compute for every dollar of revenue, and 63.4% of that spend went to training rather than serving customers.
- AI application and agent startups spent a median 26.7% of revenue on compute, nearly four times the 6.8% median for public software companies that have added AI features to existing products.
- Non-technology enterprises spent a median 0.9% of revenue on AI compute, and only 7 of the 63 in our sample exceeded 2.5%.
AI Compute Spend as a Percentage of Revenue by Startup Revenue Stage
For the 153 application, agent, and developer tools startups in the sample, compute intensity fell sharply as revenue grew. The table below groups them by annual recurring revenue (ARR).
The AI Compute Spend as a Percentage of Revenue by Startup Revenue Stage, 2026
| ARR Stage | Startups | Median Compute Spend as % of Revenue | Share of Compute Spend on Training |
|---|---|---|---|
| Under $1M | 38 | 61.3% | 39.2% |
| $1M to $5M | 44 | 38.4% | 24.6% |
| $5M to $20M | 36 | 27.2% | 19.8% |
| $20M to $50M | 21 | 21.6% | 22.4% |
| $50M and above | 14 | 17.9% | 27.1% |
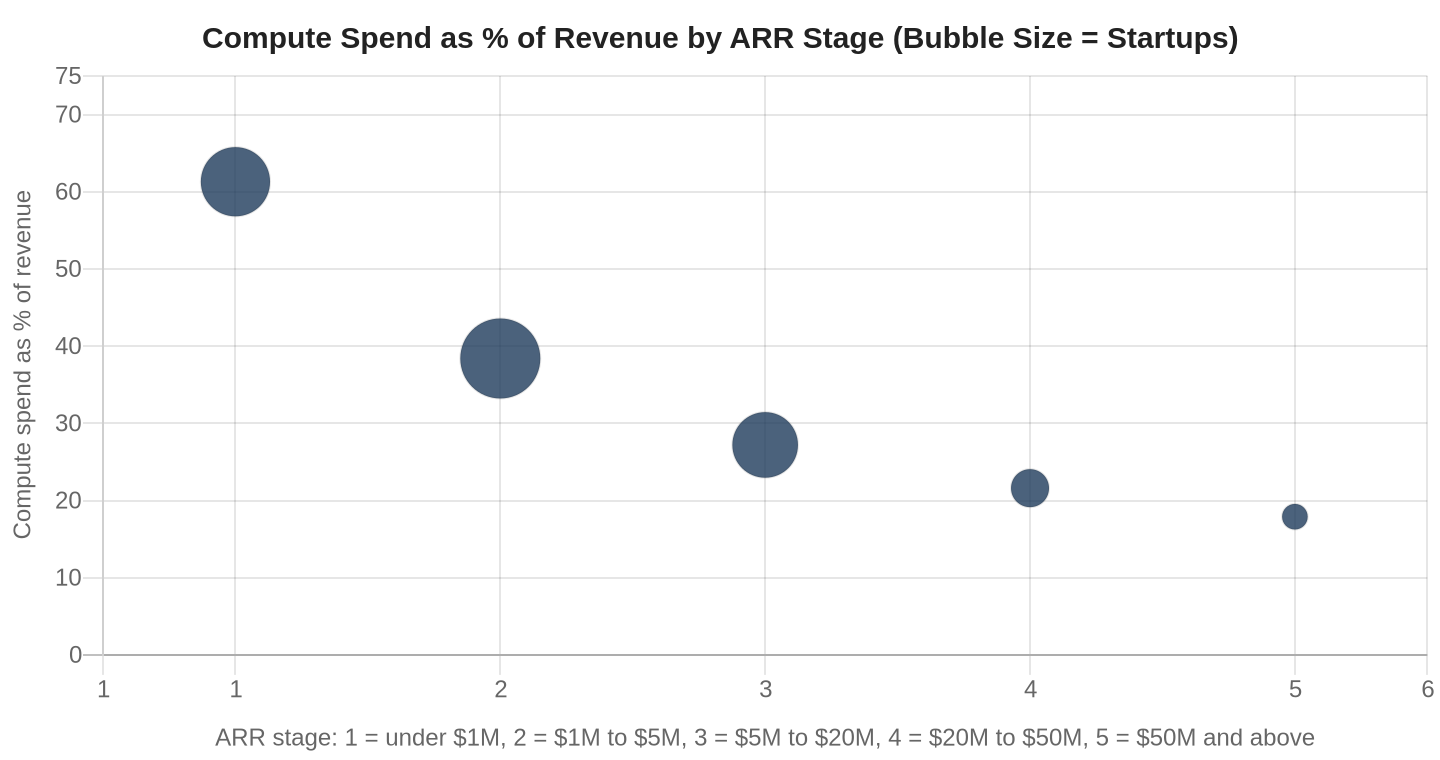
The ratio fell from 61.3% of revenue for startups under $1M in ARR to 17.9% for those above $50M. Most of the drop happens early: by the $5M to $20M stage, the median had already fallen to 27.2%. Training spend followed a different curve. Its share of compute declined through the $5M to $20M stage, to 19.8%, as early prototyping gave way to serving customers, then climbed again to 27.1% among the largest startups, many of which had begun training or post-training their own models to reduce dependence on third-party APIs.
AI Compute Spend as a Percentage of Revenue by Quarter, Q1 2024 to Q3 2026
For companies with at least ten quarters of data, we tracked the median ratio for two groups moving in opposite directions. The table below shows the series, followed by a line graph.
The Median AI Compute Spend as a Percentage of Revenue by Quarter, 2026
| Quarter | AI Application and Agent Startups | Public Software Companies With AI Features |
|---|---|---|
| Q1 2024 | 38.9% | 2.9% |
| Q2 2024 | 37.2% | 3.3% |
| Q3 2024 | 37.8% | 3.1% |
| Q4 2024 | 35.1% | 3.8% |
| Q1 2025 | 33.6% | 4.4% |
| Q2 2025 | 34.2% | 4.2% |
| Q3 2025 | 31.4% | 5.1% |
| Q4 2025 | 30.2% | 5.6% |
| Q1 2026 | 29.5% | 5.9% |
| Q2 2026 | 27.9% | 6.4% |
| Q3 2026 | 26.7% | 6.8% |
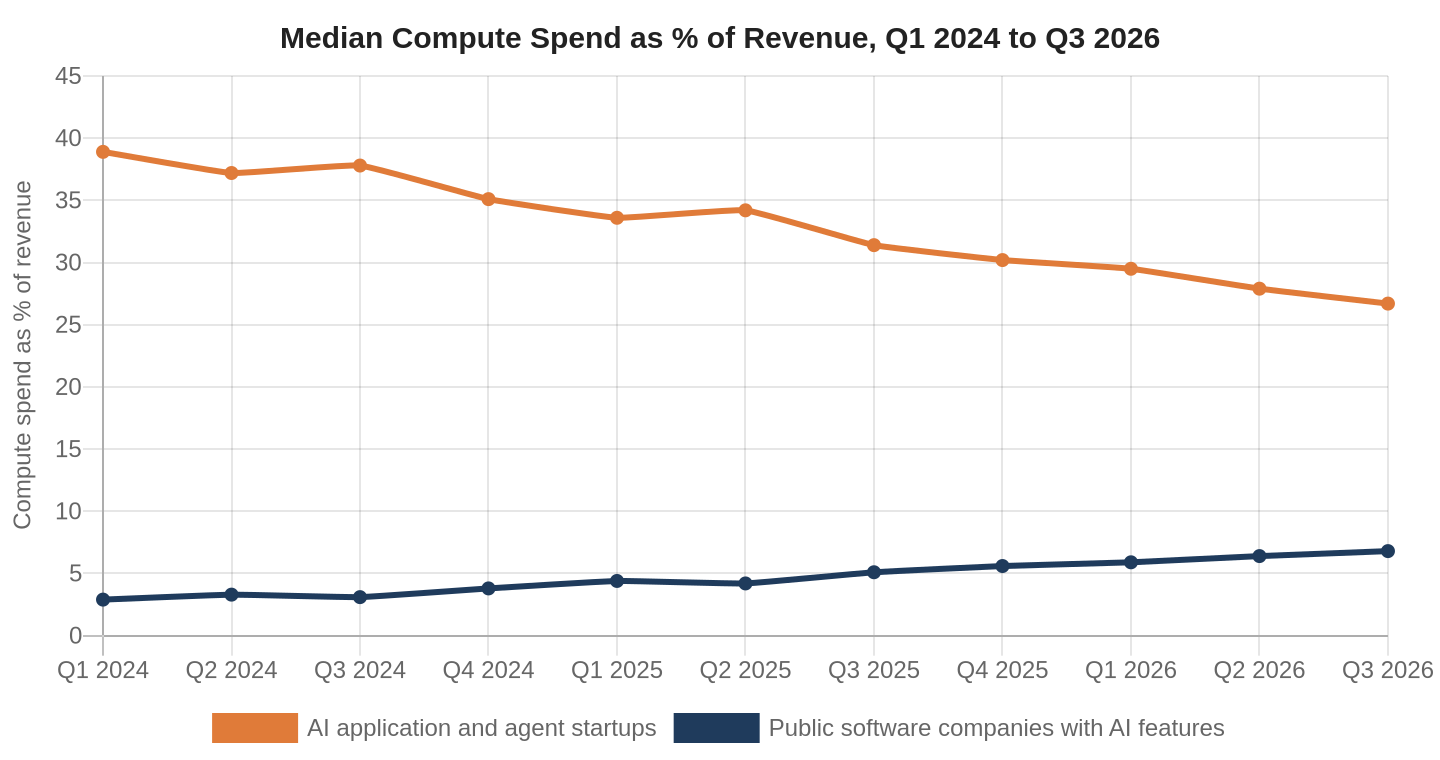
The quarterly data led to three conclusions:
- The median AI application startup cut its compute ratio by 12.2 points over the period, from 38.9% to 26.7%, as model API prices fell and startups routed more requests to smaller models.
- Public software companies more than doubled their ratio, from 2.9% to 6.8%, as AI features moved from optional add-ons into core products used by most of their customers.
- The startup series rose in two quarters, Q3 2024 and Q2 2025, both of which followed major model releases that startups adopted at launch pricing before cheaper versions arrived.
Where AI Compute Spend Goes
We classified every dollar of compute spend by where it was paid. The table below shows the split for the full sample and for three company types.
The Distribution of AI Compute Spend by Destination, 2026
| Spend Destination | All Companies | AI Application and Agent Startups | Foundation Model Developers | Non-Technology Enterprises |
|---|---|---|---|---|
| Hyperscale cloud GPU instances | 34.6% | 18.9% | 29.8% | 41.3% |
| Third-party model APIs | 28.3% | 58.6% | 1.9% | 47.2% |
| Specialized GPU cloud providers | 21.4% | 16.2% | 38.7% | 4.8% |
| Owned and colocated hardware | 15.7% | 6.3% | 29.6% | 6.7% |
AI application and agent startups paid 58.6% of their compute spend to third-party model providers, while foundation model developers paid only 1.9% and instead split their spend among specialized GPU cloud providers, hyperscale clouds, and their own hardware. Non-technology enterprises bought almost entirely through hyperscale clouds and model APIs, which together accounted for 88.5% of their spend. Across the full sample, specialized GPU cloud providers captured 21.4% of compute dollars, a share driven largely by model developers and inference platforms.
AI Compute Spend as a Percentage of Revenue by Growth Rate
Faster-growing startups spent more of their revenue on compute. The table below groups the 153 application, agent, and developer tools startups by year-over-year revenue growth.
The AI Compute Spend as a Percentage of Revenue by Growth Rate, 2026
| Year-Over-Year Revenue Growth | Startups | Median Compute Spend as % of Revenue |
|---|---|---|
| Under 50% | 29 | 22.1% |
| 50% to 100% | 46 | 25.8% |
| 100% to 200% | 49 | 29.4% |
| Over 200% | 29 | 36.9% |
The median ratio rose from 22.1% among startups growing under 50% a year to 36.9% among those growing over 200%. Two effects combine here. Fast-growing startups add usage faster than they renegotiate pricing with model providers, and many of them deliberately keep using the most capable and most expensive models to win customers before working on cost. Investors reviewing compute ratios should compare a startup against peers at a similar growth rate rather than against the stage median alone.
Sources
- AI Compute Spend Study. AI Industry Reviews. October 2026. New York, New York.
- Understanding AI Compute Costs for Startups. Kruze Consulting. San Francisco, California. https://kruzeconsulting.com/blog/ai-compute-costs/
- 2026 Report: The New Economics of Starting Up. Mercury. 2026. San Francisco, California. https://mercury.com/blog/startup-economics-report-2026
- Do AI Startups Have Worse Economics Than SaaS Shops?. TechCrunch. February 2020. San Francisco, California. https://techcrunch.com/2020/02/21/do-ai-startups-have-worse-economics-than-saas-shops/
- 150+ AI Statistics for 2026: Spend, Cost, and AI ROI. CloudZero. 2026. Boston, Massachusetts. https://www.cloudzero.com/blog/ai-statistics/
- The True Cost of Compute. Andreessen Horowitz. Menlo Park, California. https://a16z.com/podcast/the-true-cost-of-compute/