
Home / Research / AI Company Profitability Statistics
Market research · October 23, 2026
AI Company Profitability Statistics: 2026 Report
 By Darin ten Bruggencate, Founder, AI Industry Reviews
Companies that build artificial intelligence products have raised and spent enormous sums over the past three years, on chips, data centers, researchers and the electricity to run them. Revenue at many of these businesses has grown quickly, and some of the largest private labs now take in billions of dollars a quarter. Spending has grown just as fast, and in several cases faster, so a company can double its sales and still lose more money than it did the year before.
Profit has been much harder to find, so we looked at which AI companies make money and how much.
Our analysts collected income statement figures for 15 publicly traded AI-focused companies and eight large technology and chip companies from their SEC 10-K and 10-Q filings. We measured revenue, operating income and net income for each company's latest fiscal year and latest reported quarter. We then calculated operating and net profit margins. For OpenAI, Anthropic and xAI, which do not file their own public financial statements, we gathered the revenue and loss figures reported from audited statements, IPO prospectuses and SpaceX's SEC filings. Only 3 of the 15 AI-focused companies, Palantir, UiPath and Innodata, posted a net profit in their latest fiscal year.
In the following sections, we compare profit margins across publicly traded AI companies, track how those margins changed from 2021 to 2026, set them against Big Tech and AI chipmakers, and lay out the reported losses at the three largest private AI labs.
Profitability of Publicly Traded AI Companies
This section shows revenue, operating income and net income for 15 publicly traded companies whose main business is AI software, AI infrastructure or AI-driven products, using each company's most recent full fiscal year. Operating income is what a company earns from its business before interest, taxes and investment gains. Net income is the final profit or loss after all of those items.
AI-focused publicly traded companies, latest fiscal year (US$ millions)
| Company | Fiscal year end | Revenue | Operating income (loss) | Net income (loss) | Net margin |
|---|---|---|---|---|---|
| Palantir | Dec 31, 2025 | 4,475.4 | 1,414.0 | 1,625.0 | 36.3% |
| UiPath | Jan 31, 2026 | 1,610.6 | 56.8 | 282.3 | 17.5% |
| Innodata | Dec 31, 2025 | 251.7 | 39.9 | 32.2 | 12.8% |
| Symbotic | Sep 27, 2025 | 2,246.9 | (115.0) | (16.9) | -0.8% |
| Cerence | Sep 30, 2025 | 251.8 | (2.3) | (18.7) | -7.4% |
| SoundHound AI | Dec 31, 2025 | 168.9 | (23.3) | (14.0) | -8.3% |
| Tempus AI | Dec 31, 2025 | 1,271.8 | (252.9) | (245.0) | -19.3% |
| CoreWeave | Dec 31, 2025 | 5,131.0 | (46.0) | (1,167.0) | -22.7% |
| Applied Digital | May 31, 2026 | 611.3 | (236.5) | (184.3) | -30.2% |
| Veritone | Dec 31, 2025 | 92.2 | (81.3) | (111.7) | -121.2% |
| C3.ai | Apr 30, 2026 | 250.3 | (498.5) | (470.4) | -187.9% |
| BigBear.ai | Dec 31, 2025 | 127.7 | (213.9) | (293.9) | -230.2% |
| Recursion | Dec 31, 2025 | 74.7 | (648.1) | (644.8) | -863.4% |
| Aurora Innovation | Dec 31, 2025 | 3.0 | (901.0) | (816.0) | n/m |
| Serve Robotics | Dec 31, 2025 | 2.7 | (112.8) | (101.4) | n/m |
Source: AI Industry Reviews analysis of SEC 10-K filings. n/m = not meaningful; margins are shown only for companies with revenue of $50 million or more. Margins are calculated from unrounded figures in company filings.
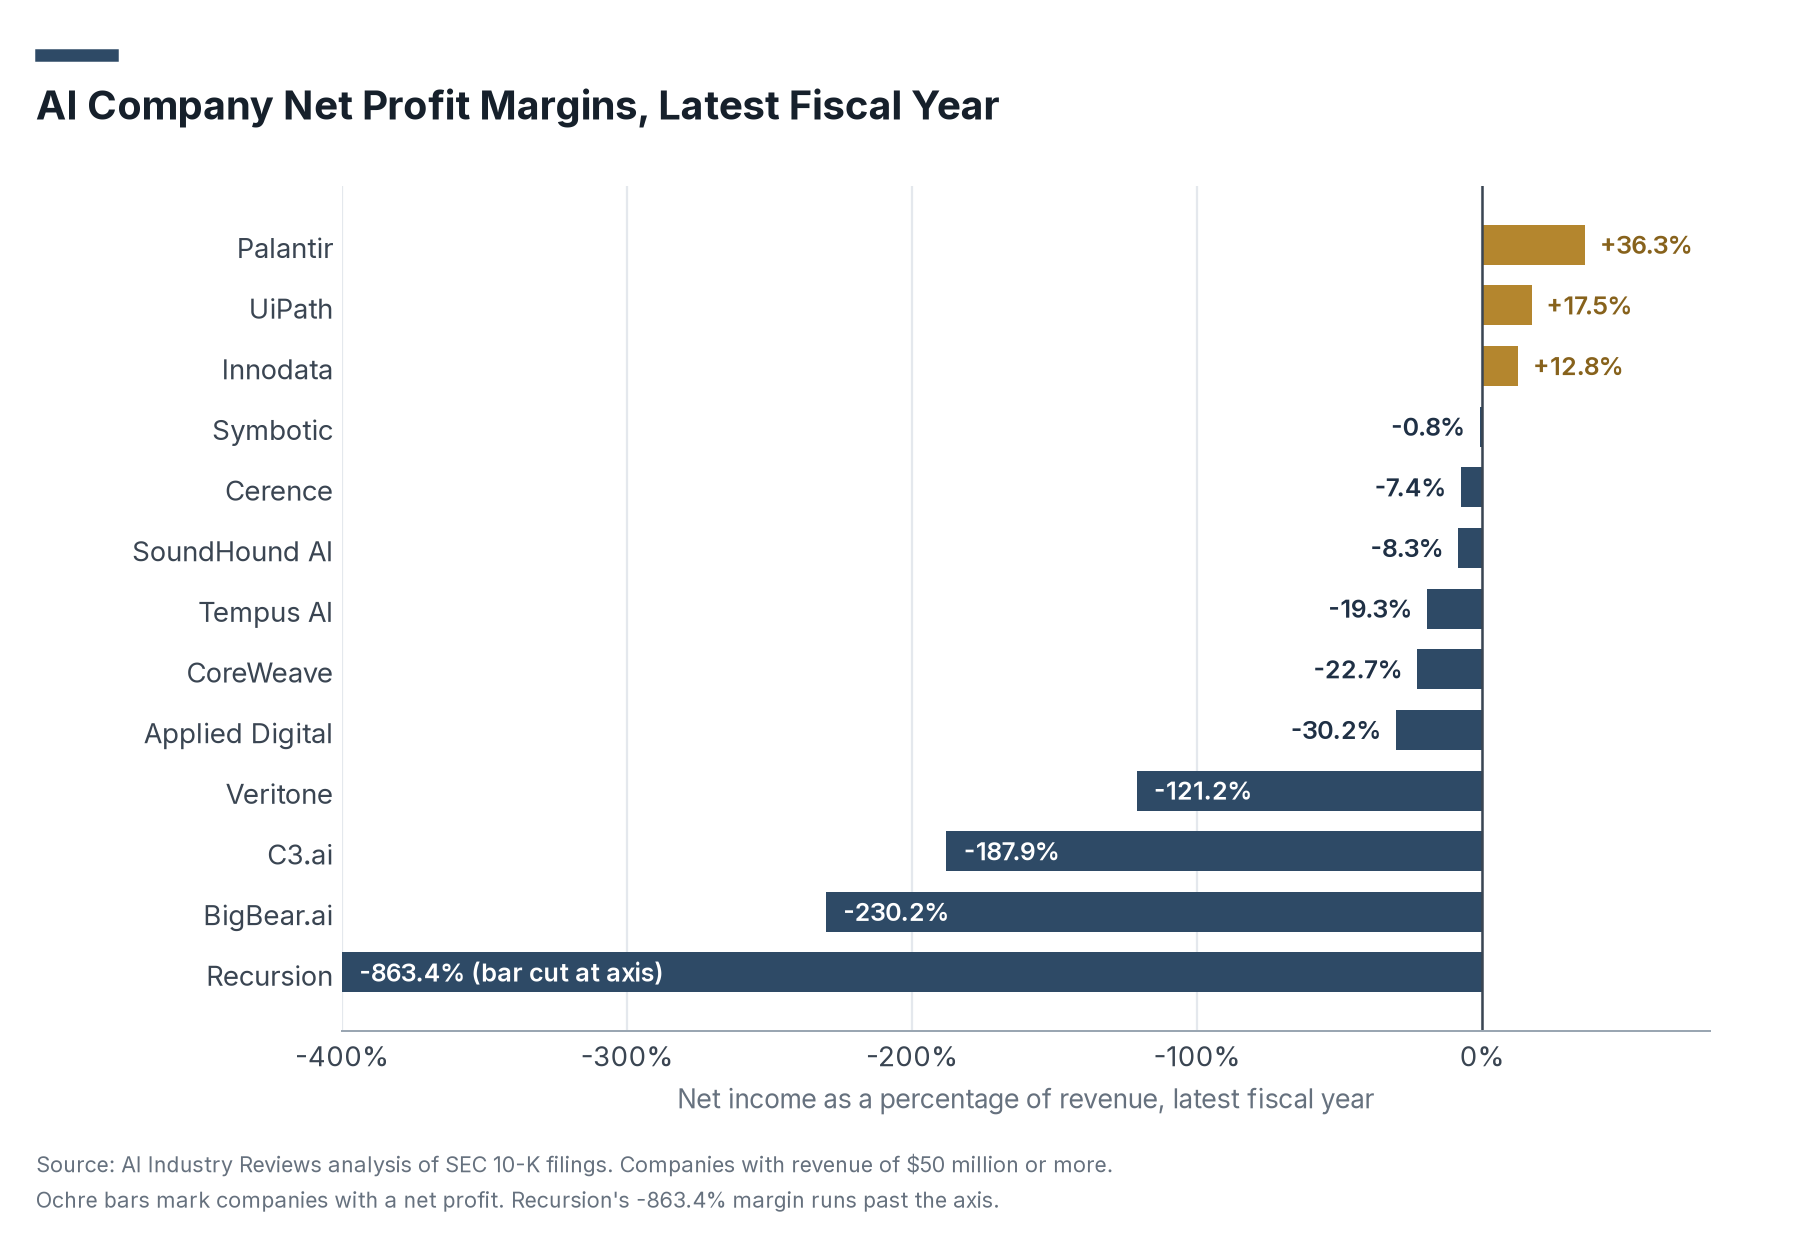
- The 15 companies brought in a combined $16.57 billion in revenue and a combined net loss of $2.14 billion. Palantir's $1.63 billion net profit offsets much of that total. Without Palantir, the other 14 companies lost a combined $3.77 billion.
- Among the 13 companies with at least $50 million in revenue, the median net margin was -19.3% and the median operating margin was -13.8%.
- CoreWeave came close to breaking even on operations, with a $46 million operating loss on $5.13 billion of revenue, but its $1.15 billion in interest expense on debt pushed its net loss to $1.17 billion. Interest costs can outweigh operating results at AI companies that borrow heavily to build data centers.
Profitability in the Latest Reported Quarter
This section uses each company's most recent quarterly filing, which for most companies covers April through June 2026. Quarterly results show whether the annual picture has shifted since the last 10-K. It adds Cerebras Systems, which went public in 2026 and has not yet filed a 10-K.
AI-focused publicly traded companies, latest reported quarter (US$ millions)
| Company | Quarter end | Revenue | Operating income (loss) | Operating margin | Net income (loss) |
|---|---|---|---|---|---|
| Palantir | Jun 30, 2026 | 1,935.5 | 912.0 | 47.1% | 1,061.9 |
| UiPath | Jul 31, 2026 | 410.3 | 31.6 | 7.7% | 36.1 |
| Symbotic | Jun 27, 2026 | 720.8 | 32.9 | 4.6% | 11.7 |
| Cerence | Jun 30, 2026 | 69.6 | 1.9 | 2.7% | 1.5 |
| CoreWeave | Jun 30, 2026 | 2,575.0 | (49.0) | -1.9% | (626.0) |
| Applied Digital | Aug 31, 2026 | 341.9 | (62.4) | -18.2% | (184.1) |
| Tempus AI | Jun 30, 2026 | 382.5 | (75.9) | -19.8% | 5.6 |
| SoundHound AI | Jun 30, 2026 | 61.9 | (43.3) | -70.0% | (42.8) |
| BigBear.ai | Jun 30, 2026 | 36.7 | (28.6) | -77.7% | (25.7) |
| Veritone | Jun 30, 2026 | 24.3 | (22.1) | -91.2% | (22.2) |
| C3.ai | Jul 31, 2026 | 52.4 | (98.3) | -187.6% | (92.8) |
| Cerebras Systems | Jun 30, 2026 | 180.1 | (477.2) | -265.0% | (450.5) |
| Innodata | Jun 30, 2026 | 92.1 | not reported | n/a | 14.4 |
| Recursion | Jun 30, 2026 | 7.7 | (135.0) | n/m | (131.0) |
| Aurora Innovation | Jun 30, 2026 | 2.0 | (266.0) | n/m | (270.0) |
| Serve Robotics | Jun 30, 2026 | 3.2 | (66.1) | n/m | (64.1) |
Source: AI Industry Reviews analysis of SEC 10-Q filings. Operating margins are shown only for companies with quarterly revenue of $10 million or more. Innodata's quarterly filing data did not include an operating income figure.
- Four of the 15 companies with an operating income figure earned an operating profit in their latest quarter: Palantir, UiPath, Symbotic and Cerence. Six of the 16 companies reported a net profit.
- Palantir's operating margin rose to 47.1% in the quarter ended June 30, 2026, from 31.6% for full-year 2025.
- Tempus AI reported a $5.6 million net profit in the quarter while its operations still lost $75.9 million, so its net figure depended on items outside its core business.
How AI Company Margins Changed from 2021 to 2026
This section follows the operating margin of five publicly traded AI companies across their last five or six fiscal years, using the same 10-K data. We chose companies with a long enough filing history to show a trend and margins that fit on one scale.
Operating margin by fiscal year, selected AI companies
| Company | FY2021 | FY2022 | FY2023 | FY2024 | FY2025 | FY2026 |
|---|---|---|---|---|---|---|
| Palantir | -26.7% | -8.5% | 5.4% | 10.8% | 31.6% | n/a |
| UiPath | -18.2% | -56.1% | -32.9% | -12.6% | -11.4% | 3.5% |
| Innodata | n/a | n/a | 0.4% | 14.3% | 15.8% | n/a |
| Tempus AI | n/a | -82.8% | -36.9% | -99.7% | -19.9% | n/a |
| C3.ai | -32.9% | -77.6% | -108.9% | -102.5% | -83.4% | -199.2% |
Source: AI Industry Reviews analysis of SEC 10-K filings. Fiscal years follow each company's own labels. UiPath's fiscal year ends January 31 and C3.ai's ends April 30. n/a means the year was not reported in the structured filing data or has not ended.
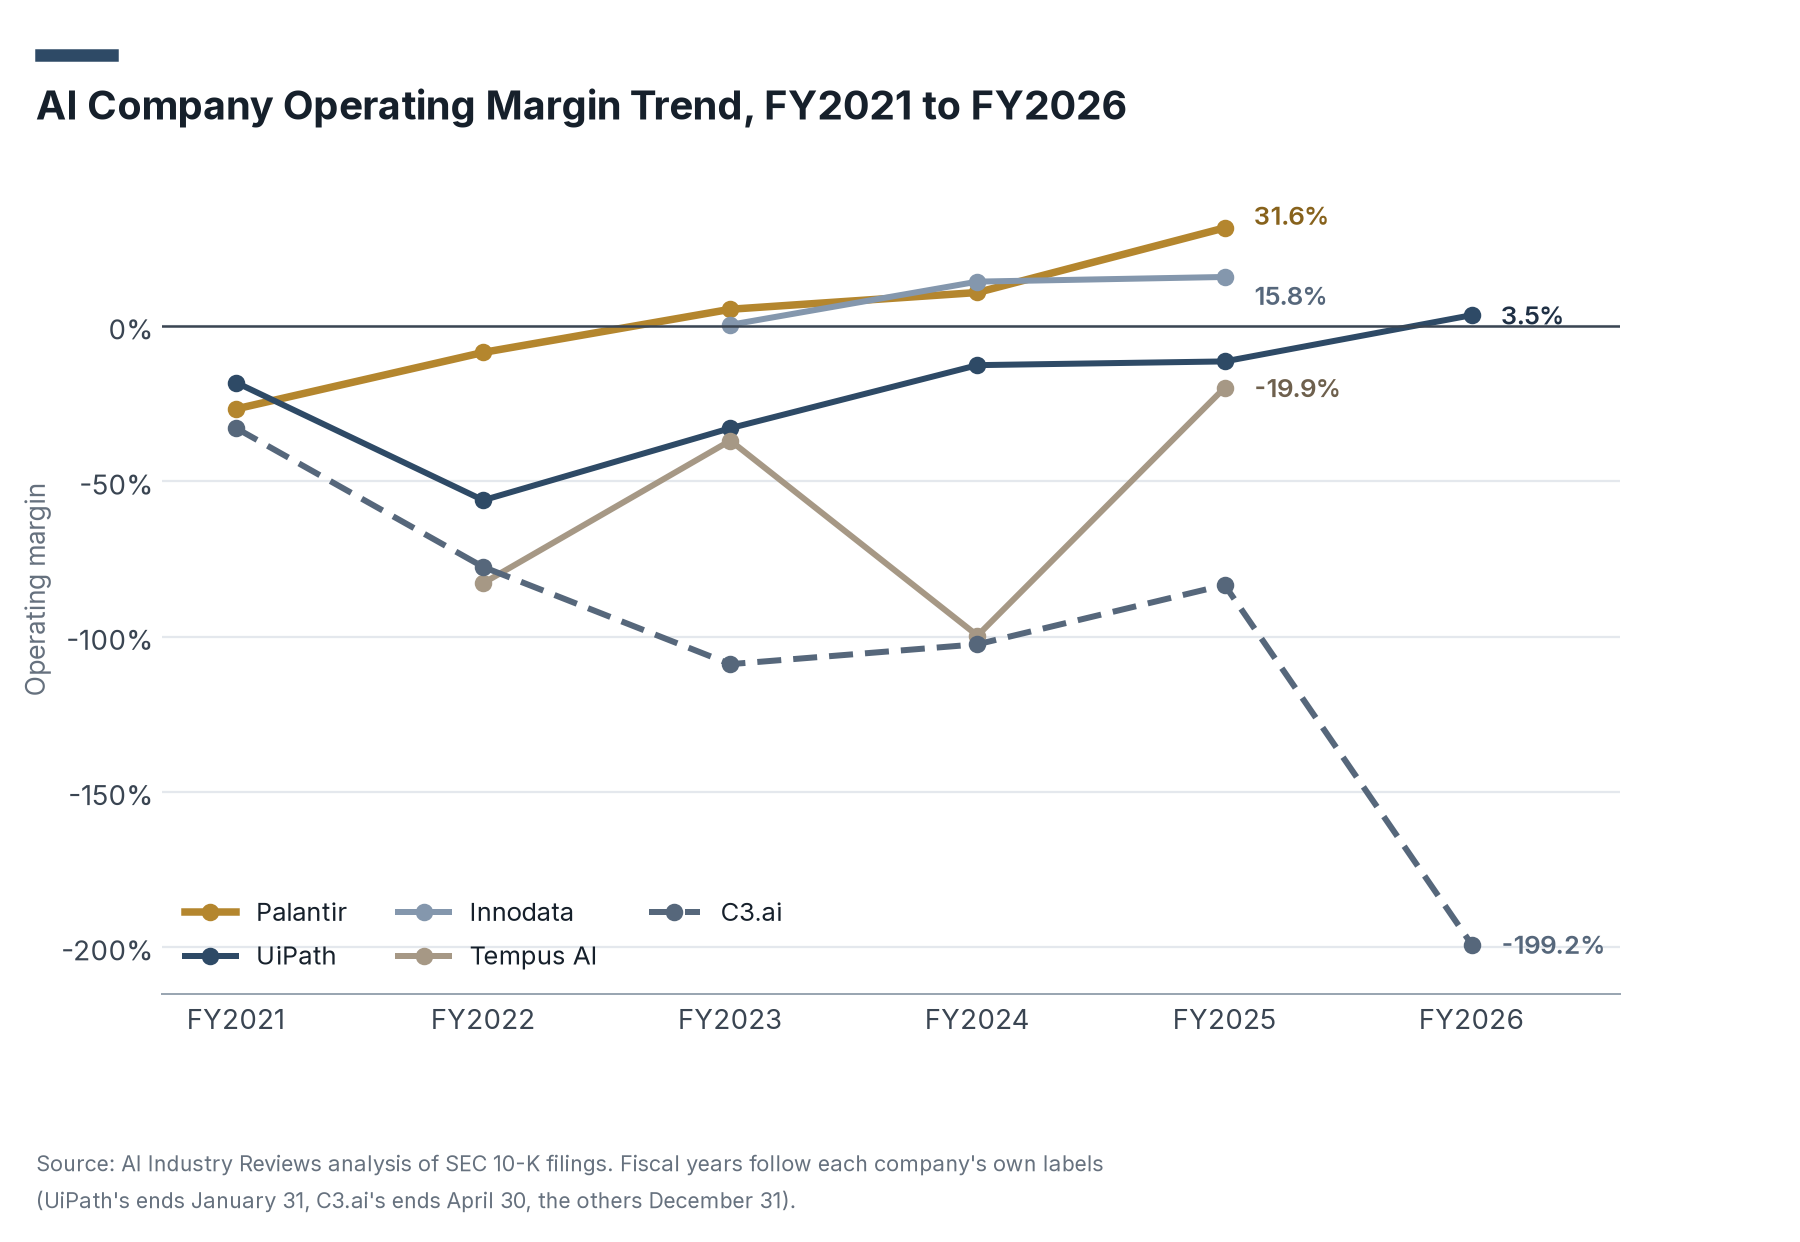
- Palantir moved from a -26.7% operating margin in 2021 to 31.6% in 2025, and UiPath reached an operating profit in fiscal 2026 for the first time in the years shown.
- C3.ai went the other way. Its revenue fell from $389.1 million in fiscal 2025 to $250.3 million in fiscal 2026 while its operating loss grew to $498.5 million.
- Tempus AI's margin improved in 2023, fell back to -99.7% in 2024 and improved again to -19.9% in 2025. Palantir and Innodata, the two companies with an operating profit in each year from 2023 to 2025, improved their margins in each of those years.
Big Tech and AI Chipmaker Profitability
This section compares the AI-focused companies with eight large technology and semiconductor companies that sell the chips, cloud capacity and software platforms AI products run on, alongside many other products.
Large technology and chip companies, latest fiscal year (US$ millions)
| Company | Fiscal year end | Revenue | Operating income | Net income | Operating margin | Net margin |
|---|---|---|---|---|---|---|
| Nvidia | Jan 25, 2026 | 215,938 | 130,387 | 120,067 | 60.4% | 55.6% |
| Microsoft | Jun 30, 2026 | 331,839 | 155,237 | 133,749 | 46.8% | 40.3% |
| Meta | Dec 31, 2025 | 200,966 | 83,276 | 60,458 | 41.4% | 30.1% |
| Broadcom | Nov 2, 2025 | 63,887 | 25,484 | 23,126 | 39.9% | 36.2% |
| Alphabet | Dec 31, 2025 | 402,836 | 129,039 | 132,170 | 32.0% | 32.8% |
| Oracle | May 31, 2026 | 67,357 | 20,606 | 17,087 | 30.6% | 25.4% |
| Amazon | Dec 31, 2025 | 716,924 | 79,975 | 77,670 | 11.2% | 10.8% |
| AMD | Dec 27, 2025 | 34,639 | 3,694 | 4,335 | 10.7% | 12.5% |
Source: AI Industry Reviews analysis of SEC 10-K filings.
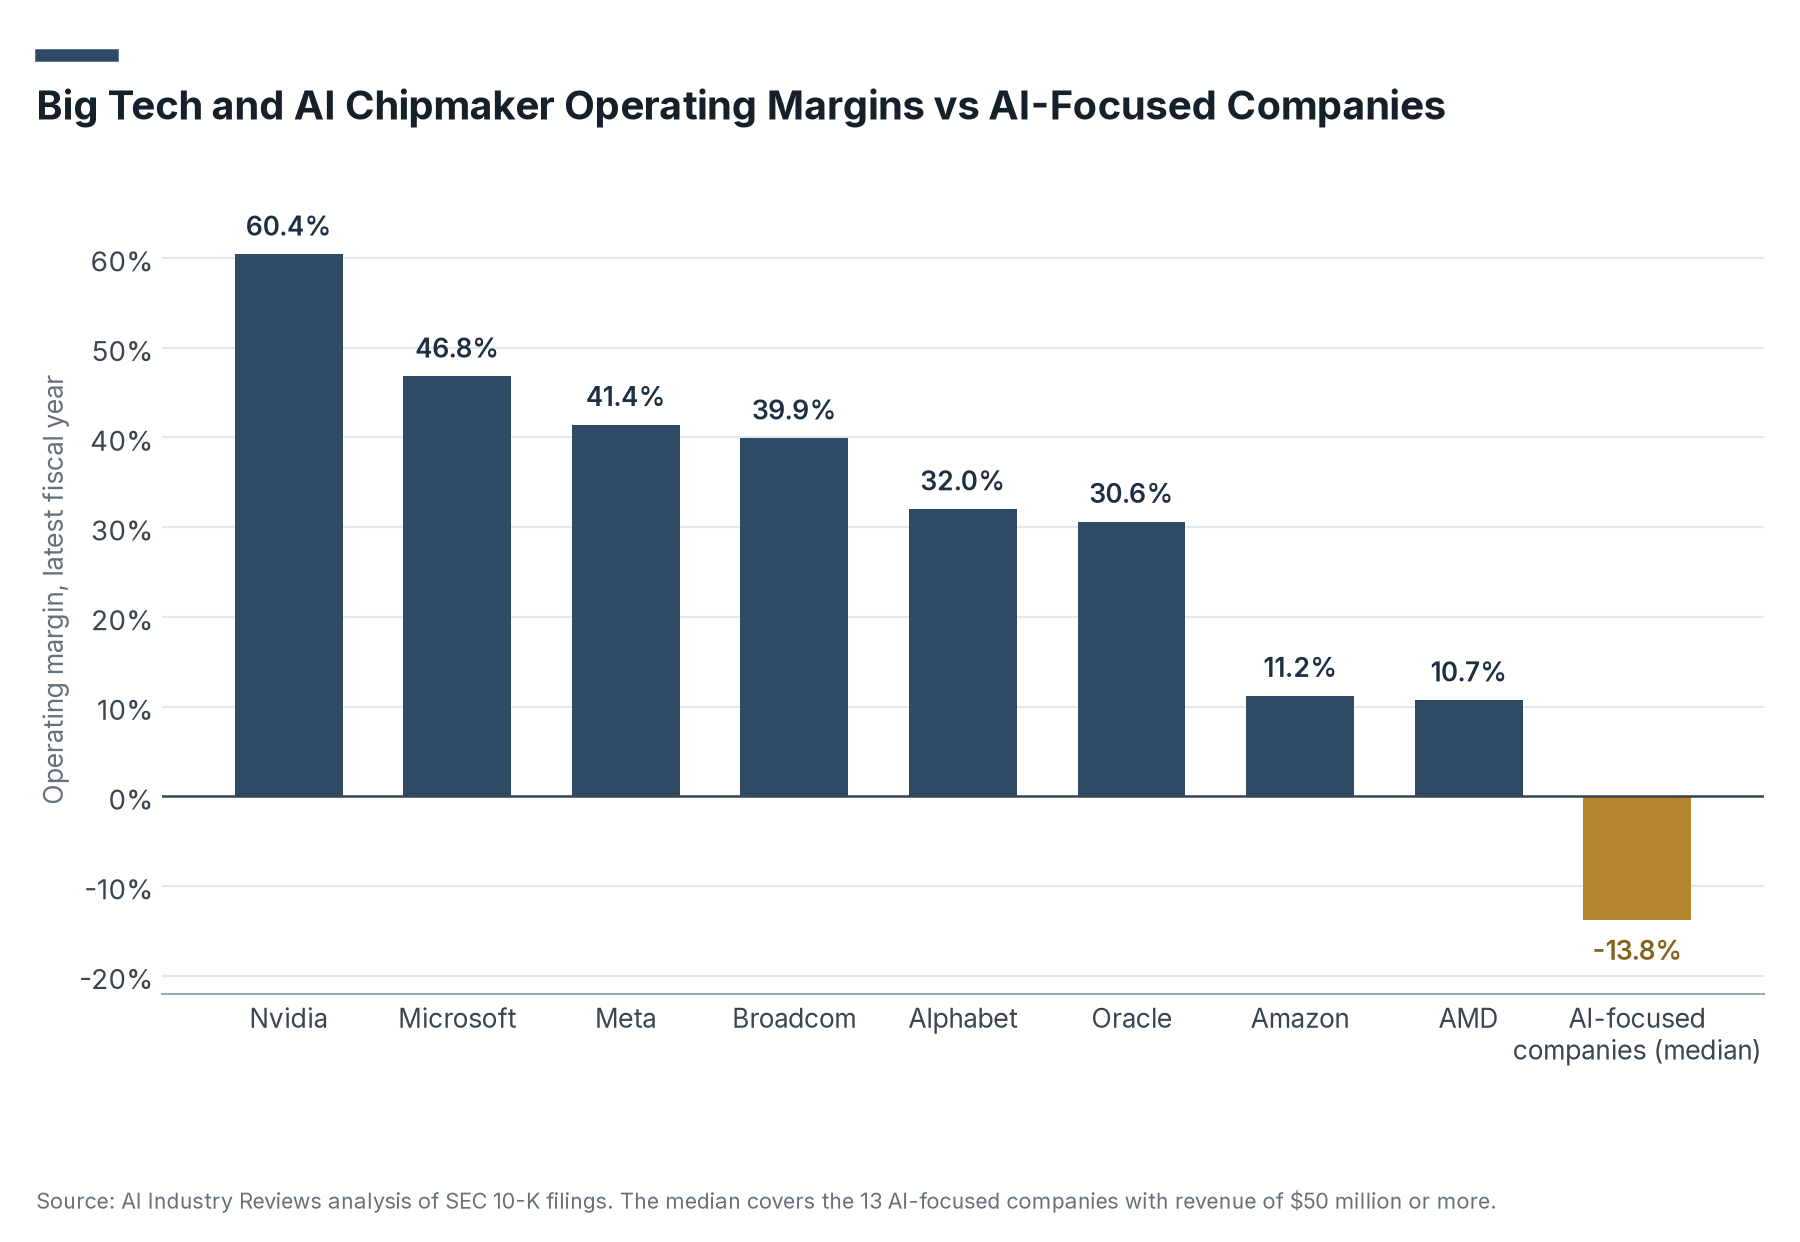
- The eight companies earned a combined $568.7 billion in net income on $2.03 trillion of revenue. Their median operating margin was 36.0%, against -13.8% for the median AI-focused company.
- Nvidia's operating margin was 60.4% in fiscal 2026, the highest in the group. Its $120.1 billion in net income was more than seven times the combined revenue of the 15 AI-focused companies.
- Net income at these companies can also move with the value of their investments. Alphabet's $112.2 billion net income in the second quarter of 2026 included $99.0 billion of net gains on equity securities, according to its earnings release, so most of that quarter's profit came from investment gains.
OpenAI, Anthropic and xAI Losses
This section brings together the revenue and loss figures reported for the three largest private AI labs. OpenAI and Anthropic do not publish financial statements, so these figures come from audited statements and draft prospectuses reviewed by news outlets. xAI's figures come from SpaceX, which bought xAI and reports it in a segment of its SEC filings. That segment also includes the X social network and, since August 14, 2026, the coding software company Cursor.
Reported revenue and losses at private AI labs (US$ billions)
| Company | Period | Revenue | Operating income (loss) | Net income (loss) | Source |
|---|---|---|---|---|---|
| OpenAI | 2024 | 3.70 | (8.78) | (5.09) | Audited statements, via Ars Technica and Quartz |
| OpenAI | 2025 | 13.07 | (20.92) | (38.5) | Audited statements, via Ars Technica and Quartz |
| OpenAI | Q1 2026 | 5.7 | (9.3) | more than (21.3) | The Information, via The Decoder |
| OpenAI | Q2 2026 | 6.7 | (12.3) | not reported | The Wall Street Journal |
| Anthropic | 2024 | not reported | (2.98) | not reported | Draft prospectus, via Fortune |
| Anthropic | 2025 | nearly 4.6 | (8.06) | nearly (42) | Draft prospectus, via Reuters and Fortune |
| Anthropic | H1 2026 | 16.3 | not reported | (80.7) | Draft prospectus, via The Wall Street Journal and Quartz |
| xAI (SpaceX AI segment) | 2025 | 3.2 | (6.36) | not reported | SpaceX prospectus, via PitchBook |
| xAI (SpaceX AI segment) | Q1 2026 | 0.818 | (2.47) | not reported | SpaceX prospectus, via PitchBook |
| SpaceX AI segment | Q2 2025 | 0.737 | (1.524) | not reported | SpaceX Form 10-Q (prior-year quarter) |
| SpaceX AI segment | Q3 2025 | 0.813 | (1.722) | not reported | SpaceX Form 10-Q (prior-year quarter) |
| SpaceX AI segment | Q2 2026 | 2.561 | (1.257) | not reported | SpaceX Form 10-Q |
| SpaceX AI segment | Q3 2026 | 7.560 | 0.431 | not reported | SpaceX Form 10-Q |
Source: AI Industry Reviews compilation of the cited reports and filings. OpenAI quarterly operating losses include stock-based compensation. SpaceX AI segment figures for 2025 quarters are the prior-year comparisons in its 2026 10-Q filings.
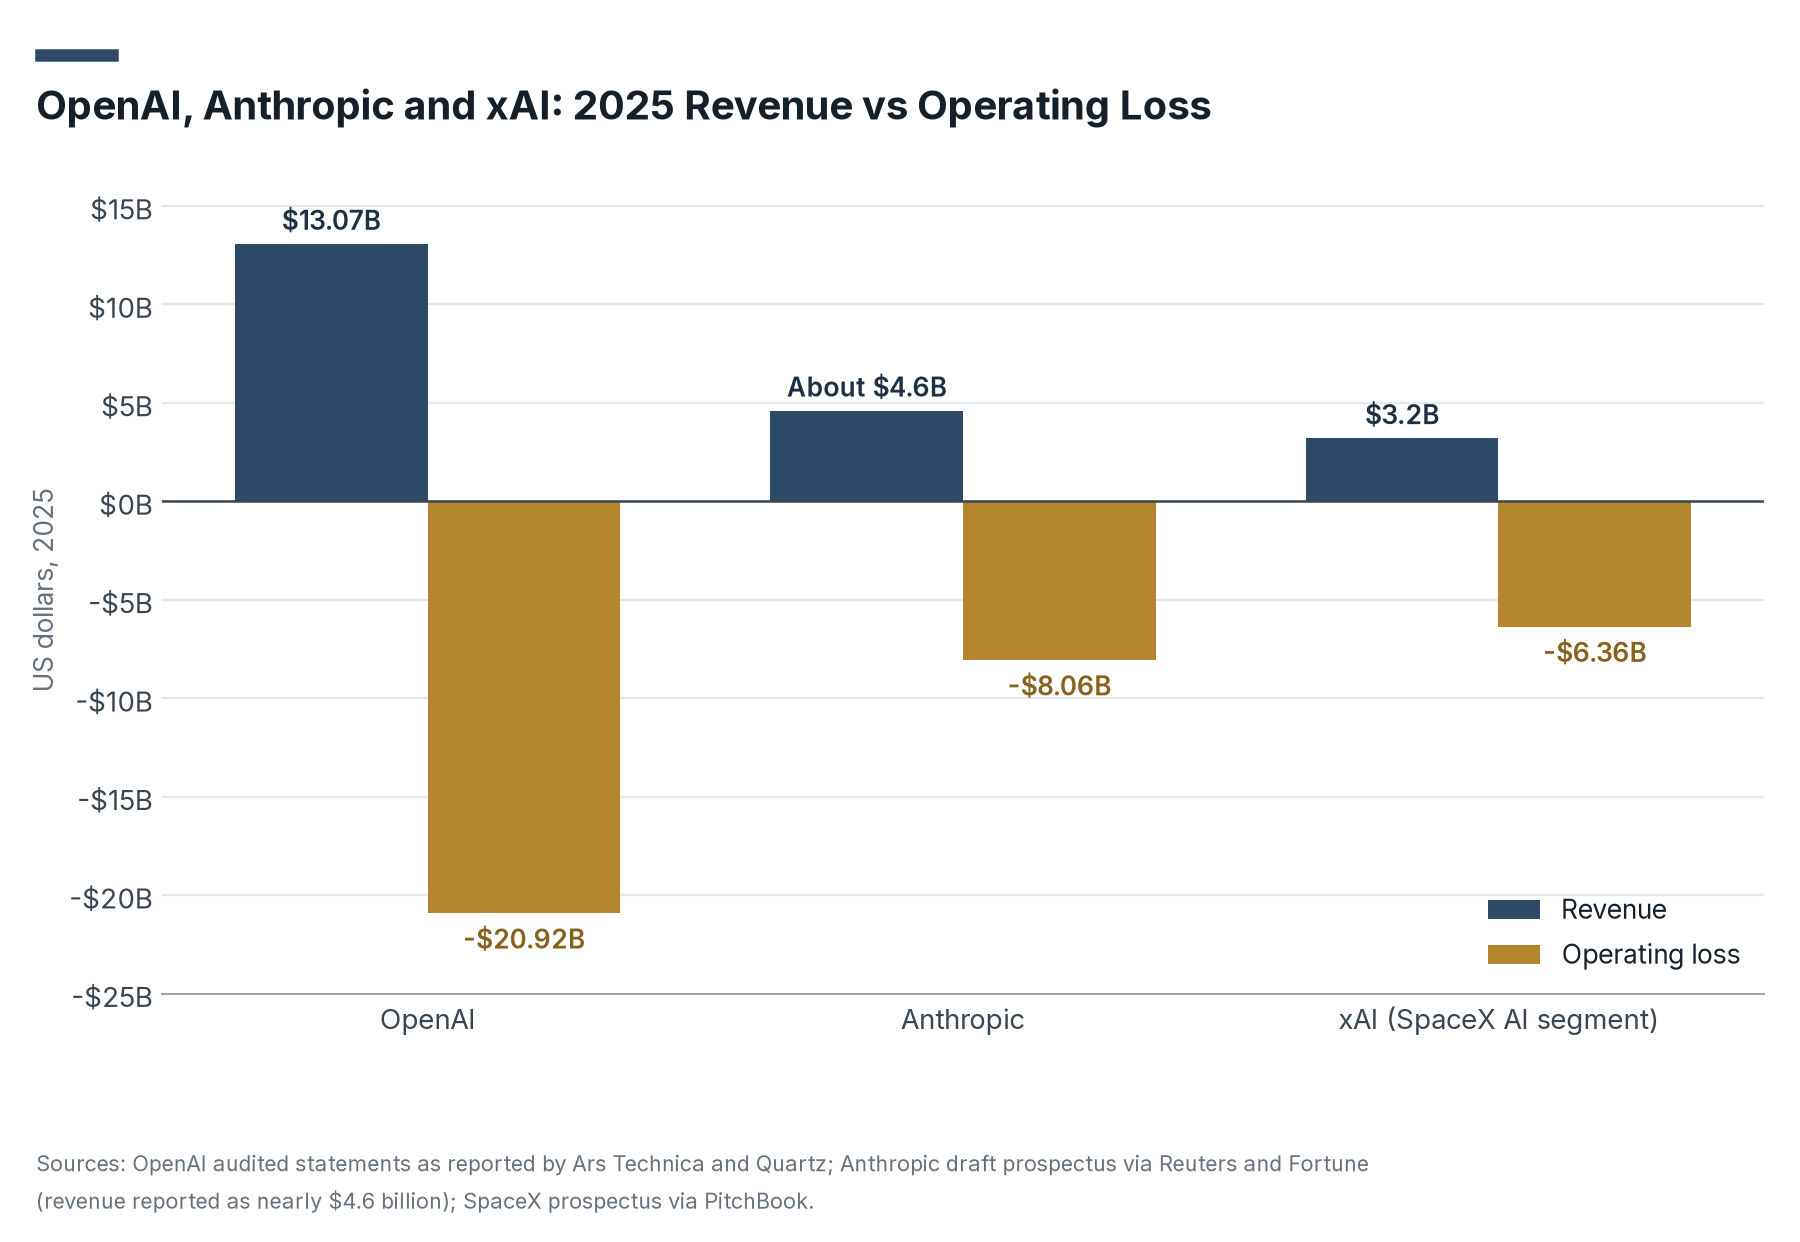
- OpenAI's operating loss equaled 160% of its revenue in 2025, down from 237% in 2024, as reported by Ars Technica. Its losses still grew in dollars, and the 2026 quarters reported so far show the operating loss widening from $9.3 billion to $12.3 billion.
- Most of the gap between operating and net losses at OpenAI and Anthropic comes from non-cash accounting charges tied to investor financing. Anthropic's 2025 net loss included a charge of roughly $34 billion, and its first-half 2026 net loss included a $72 billion charge, according to the reports.
- Anthropic's revenue rose to $11.6 billion in the second quarter of 2026 with a small operating profit, The Wall Street Journal reported, and Anthropic told investors that third-quarter revenue reached $16.8 billion and was profitable on an adjusted basis, according to Reuters as cited by Quartz. Neither profit figure was given in dollars, and Anthropic has not publicly defined the adjusted measure.
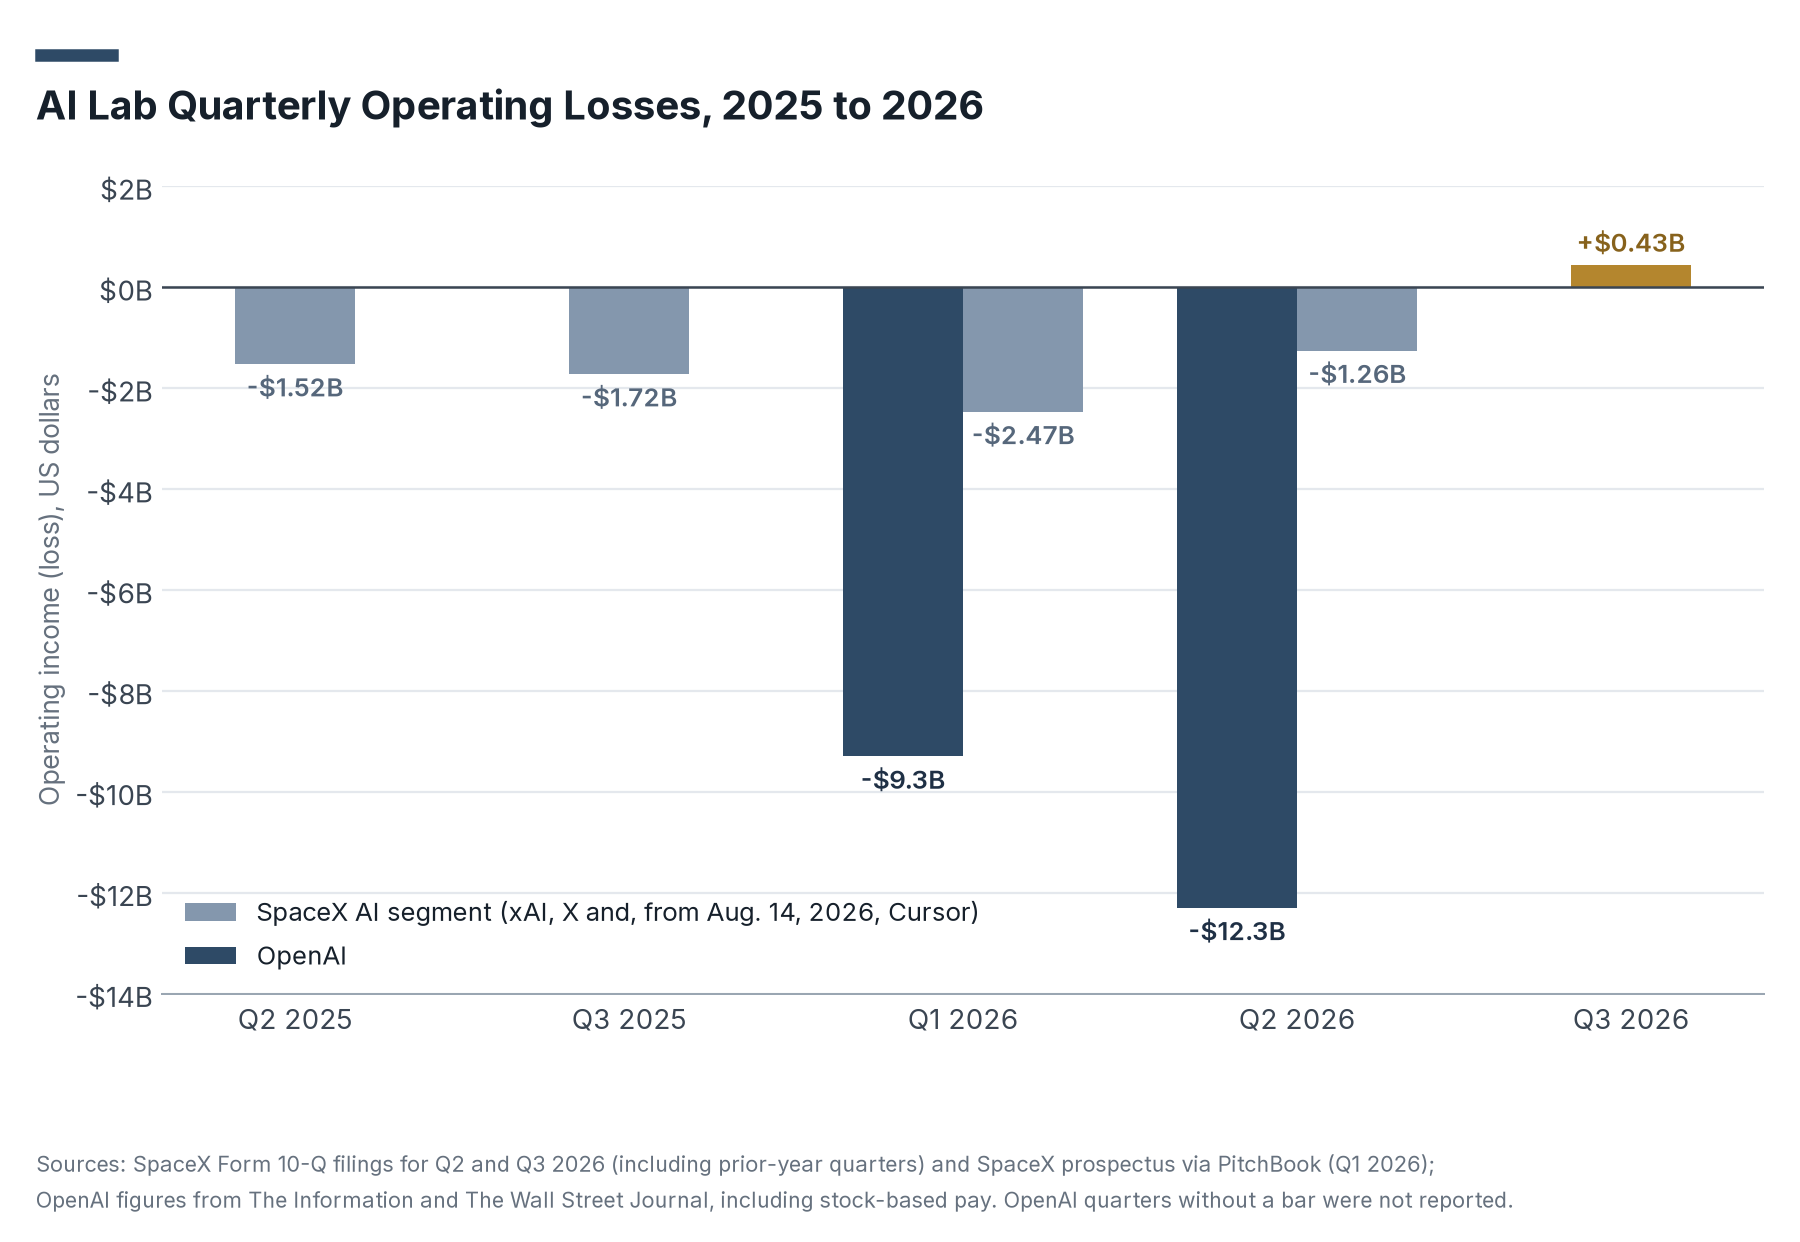
- SpaceX's AI segment moved from a $1.26 billion operating loss in the second quarter of 2026 to a $431 million operating profit in the third quarter, on revenue of $7.56 billion. Over the first nine months of 2026 the segment still lost $3.30 billion on operations.
- The third-quarter jump came after Cursor joined the segment in August and after Anthropic agreed in May to pay xAI $1.25 billion a month for computing capacity, as PitchBook reported. The filing does not break out how much each source contributed.
What Outside Research Says About AI Profitability
This section adds two outside reference points that help explain why losses at AI companies remain large even as revenue grows.
- Bain & Company's 2025 Global Technology Report estimated that about $2 trillion in annual revenue will be needed by 2030 to fund the computing power that AI demand requires, and that the industry could fall about $800 billion short of that even after expected savings from AI.
- OpenAI told investors it hopes to be profitable by 2030, Ars Technica reported. In November 2025, The Information reported that Anthropic's best-case outlook included $17 billion in cash flow in 2028. Both are company projections.
What These Numbers Mean for the AI Industry
The money in AI has so far gone mostly to the companies that supply it. Nvidia, Microsoft, Alphabet and the other large platforms earned hundreds of billions of dollars while most of the companies building AI products reported losses, and OpenAI, Anthropic and xAI together lost more than $35 billion on operations in 2025.
That split is starting to shift at the edges, with operating profits at Palantir and UiPath and profitable quarters in 2026 at Anthropic and SpaceX's AI segment. OpenAI and Anthropic have both filed draft IPO paperwork with the SEC, and a public listing would put their audited quarterly results in front of investors.
The larger question is whether revenue can catch up with the spending commitments these companies have made for data centers and chips. Anthropic disclosed $518 billion in future cloud and computing obligations in its September draft prospectus, and those costs will arrive whether or not demand keeps pace. So if you are comparing AI companies on profitability, look at operating income in the most recent quarters, because net income at both the labs and their largest investors now swings on accounting charges and gains.
Data Collection and Methodology
We pulled revenue, operating income and net income for each company from the structured financial data that companies submit with their SEC filings, and kept the most recently filed value for each period so that restated figures replace earlier versions. Data was collected on October 23, 2026.
The AI-focused group covers 15 US publicly traded companies whose main business is AI software, AI infrastructure or AI-driven products: Palantir, UiPath, Innodata, Symbotic, Cerence, SoundHound AI, Tempus AI, CoreWeave, Applied Digital, Veritone, C3.ai, BigBear.ai, Recursion, Aurora Innovation and Serve Robotics. Cerebras Systems appears only in the quarterly table because it has not yet filed a 10-K. The comparison group covers eight large technology and chip companies: Nvidia, Microsoft, Meta, Broadcom, Alphabet, Oracle, Amazon and AMD. We left out foreign companies that file annual reports on Form 20-F.
Each company's latest fiscal year is the most recent year covered by a 10-K, so fiscal year ends differ. The latest quarter is the most recent three-month period in a 10-Q. Microsoft's latest fiscal year ended June 30, 2026, so it is covered in the annual table only.
Net margin is net income divided by revenue, and operating margin is operating income divided by revenue. To keep companies with almost no sales from setting the extremes, we calculated annual margins and medians only for companies with at least $50 million in revenue, and quarterly margins only for companies with at least $10 million in quarterly revenue. For Applied Digital and Broadcom we used net income including noncontrolling interests, meaning before the share that belongs to minority owners is subtracted, because that was the full-period figure each company reported. Margins and totals were calculated from unrounded filing values and rounded once.
Figures for OpenAI, Anthropic and xAI come from the reports and filings in Sources and keep the precision those sources gave. OpenAI and Anthropic figures are drawn from audited statements, draft prospectuses and investor materials described by news outlets, and have not been published by the companies. SpaceX's AI segment, called the Super Intelligence segment from its third-quarter 2026 filing onward, includes xAI, X and, from August 14, 2026, Cursor. The OpenAI and Anthropic operating margins we cite are either reported by the sources or calculated by us from the reported revenue and operating loss.
All figures were reported in US dollars, so no currency conversion was needed.
Sources
- AI Industry Reviews, AI Company Profitability Statistics: 2026 Report. Our aggregation of revenue, operating income and net income from SEC 10-K and 10-Q filings for 23 publicly traded companies, plus cited reporting on OpenAI, Anthropic and xAI.
- SEC EDGAR, structured company financial data and filings for Palantir, UiPath, Innodata, Symbotic, Cerence, SoundHound AI, Tempus AI, CoreWeave, Applied Digital, Veritone, C3.ai, BigBear.ai, Recursion, Aurora Innovation, Serve Robotics, Cerebras Systems, Nvidia, Microsoft, Meta, Broadcom, Alphabet, Oracle, Amazon and AMD.
- Space Exploration Technologies Corp., Form 10-Q for the quarter ended September 30, 2026, Note 18 (Segments).
- Space Exploration Technologies Corp., Form 10-Q for the quarter ended June 30, 2026, segment note.
- Alphabet Inc., Q2 2026 earnings release (Exhibit 99.1).
- Ars Technica, Leaked financial docs show OpenAI is losing billions of dollars a year, June 2026.
- Quartz, OpenAI 2025 financials leaked: $38.5B loss ahead of IPO, July 3, 2026.
- The Decoder, OpenAI tripled revenue to $5.7 billion in Q1 but burned through $3.7 billion to get there, citing The Information.
- Reuters, OpenAI burned $3.7 billion in first quarter of 2026, The Information reports, June 16, 2026.
- The Wall Street Journal, OpenAI's Second-Quarter Sales Show Tepid Growth Compared With Anthropic, August 2026, as summarized by Yahoo Finance.
- Reuters via CNBC, Anthropic's IPO prospectus shows sweeping AI vision, surging costs, September 28, 2026.
- Fortune, Anthropic's leaked IPO prospectus details steep losses, rapid growth, and a fear that AI could end humanity, September 29, 2026.
- Quartz, Anthropic's first-half net loss reached $80.7 billion, draft IPO filing shows, October 21, 2026.
- Techmeme summary of The Wall Street Journal on Anthropic's first-half 2026 revenue, October 20, 2026.
- PitchBook, 'Financials look reckless': Lifting the xAI hood in the SpaceX IPO, May 20, 2026.
- Bain & Company, $2 trillion in new revenue needed to fund AI's scaling trend, 6th annual Global Technology Report, September 2025.
- OpenAI, Confidential submission of draft S-1 to the SEC, June 8, 2026.
- The Information, Anthropic Projects $70 Billion in Revenue, $17 Billion in Cash Flow in 2028, November 2025.