
Home / Research / Agentic AI Adoption Rate by Industry
Market research · October 9, 2026
Agentic AI Adoption Rate, by Industry: 2026 Report
Large companies have started to put AI agents to work, meaning software that can plan a task and carry out several steps with limited human direction, and consulting firms including McKinsey, KPMG and Deloitte now publish how far that has gone in each industry. We studied the agentic AI adoption rate by industry in five surveys from McKinsey, KPMG and Deloitte, fielded between June 2025 and June 2026, compared industries within each survey, and tracked McKinsey's industry results from 2025 to 2026. Census Bureau figures on general AI use by sector appear separately as context.
An industry's agentic AI adoption rate is the share of surveyed organizations in that industry that report using AI agents at a stated level. Each survey sets that level differently. McKinsey counts organizations that are scaling agents inside a given business function. Deloitte counts organizations using agentic AI at least moderately. KPMG's global survey counts any stage from first deployment up to multi-agent systems, and its US industries survey reports deploying and piloting separately. Because each survey measures a different level of use, industries are ranked only within a survey.
Agentic AI Survey Sources and Definitions
Surveys used, with industry breakdowns
| Survey | Fieldwork | Respondents | Geography | What Counts as Adoption | Industries Reported |
|---|---|---|---|---|---|
| McKinsey Global Survey on the state of AI, 2026 | May 4 to June 8, 2026 | 1,719 | 97 countries | Scaling or fully scaled AI agents in a business function | 12 |
| McKinsey Global Survey on the state of AI, 2025 | June 25 to July 29, 2025 | 1,993 | Global | Scaling or fully scaled AI agents in a business function | 12 |
| KPMG Global AI Pulse, Q1 2026 | Feb. 19 to Mar. 17, 2026 | 2,110 | 20 countries | Deploying agents, scaling them, orchestrating them, or building multi-agent systems | 8 |
| KPMG Quarterly AI Pulse Survey: Industries | Nov. 7 to Dec. 15, 2025 | Over 100 per industry | United States | Deploying or piloting AI agents | 3 |
| Deloitte State of AI in the Enterprise, 2026 edition | Aug. to Sept. 2025 | 3,235 | 24 countries | Moderate, extensive or fully integrated use of agentic AI | 5 of 6 surveyed |
McKinsey defines agents as "AI systems based on foundation models that act in the real world and are capable of autonomously planning and executing multiple steps in a workflow." It asked about the phase of agent use in each function only of respondents whose organizations regularly use AI in that function, then reported the answers as a share of all respondents in the industry. McKinsey's figures for human resources and for strategy and corporate finance are not included, so its results here cover 9 business functions.
KPMG asked, "In what capacity is your organization engaging with AI agents?" The answer stages run from exploring and piloting through deploying, scaling across functions, orchestrating multiple agents across workflows, and developing or implementing multi-agent systems. KPMG's respondents work at organizations with at least $100 million in revenue, and three-quarters of them at $1 billion or more. Its sector table shows the four stages from deploying upward, and we added them to get the share at the deploying stage or beyond. KPMG adds its stages the same way in its own summary, where 14% deploying and 18% scaling make the 32% it reports as deploying and scaling. The US industries survey covered organizations with revenue of $1 billion or more.
Deloitte asked, "To what extent is your organization utilizing agentic AI in its operations?" Every organization in its sample already had at least one AI implementation in daily use. Government and public services, the sixth industry Deloitte surveyed, is not included.
Surveys run by AI vendors, and surveys that report agent adoption only for all respondents, are left out. The Census Bureau's Business Trends and Outlook Survey asks about AI in general and appears in its own section as context. Figures were collected on October 8, 2026.
Agentic AI Adoption Rate by Sector in 2026
AI agent engagement by sector, KPMG Global AI Pulse, February to March 2026 (% of respondents)
| Sector | Deploying | Scaling Across Functions | Orchestrating Across Workflows | Developing Multi-Agent Systems | Deploying or Beyond |
|---|---|---|---|---|---|
| Technology, media and telco | 14% | 20% | 11% | 21% | 66% |
| Industrial manufacturing and automotive | 15% | 20% | 11% | 19% | 65% |
| Life sciences | 20% | 8% | 14% | 16% | 58% |
| Real estate and construction | 12% | 22% | 5% | 18% | 57% |
| Consumer and retail | 16% | 18% | 7% | 16% | 57% |
| Energy and natural resources | 15% | 23% | 8% | 11% | 57% |
| Healthcare | 12% | 16% | 11% | 15% | 54% |
| Financial services | 10% | 18% | 7% | 15% | 50% |
| All respondents | 14% | 18% | 9% | 17% | 58% |
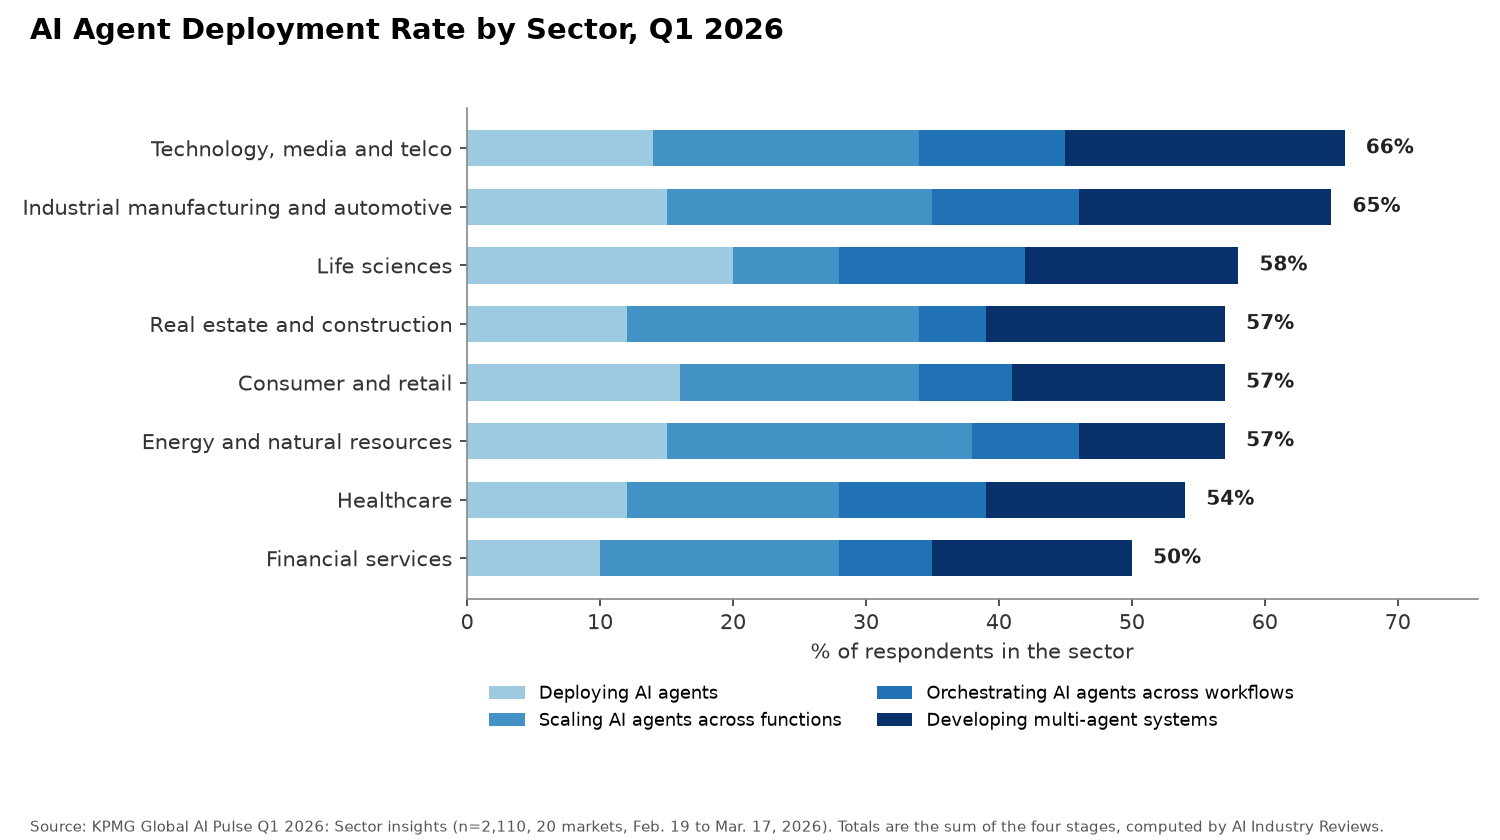
- Technology, media and telco has the highest share at the deploying stage or beyond, 66%, followed by industrial manufacturing and automotive at 65%.
- Financial services has the lowest share at the deploying stage or beyond, 50%, and the lowest share in the deploying stage alone, 10%. KPMG describes the sector as operating "within tightly regulated conditions, with orchestration more constrained by compliance complexity."
- Technology, media and telco also has the largest share developing multi-agent systems, 21%. Energy and natural resources has the smallest, 11%, and the largest share scaling agents across functions, 23%.
- Life sciences has the largest share in the deploying stage alone, 20%, and the smallest share scaling agents across functions, 8%.
- Across all 2,110 respondents, 22% were still exploring the possibility of using AI agents and 17% were piloting them.
Agentic AI Use by Industry, Today and in Two Years
Extent of agentic AI use by industry, Deloitte, August to September 2025 (% of respondents)
| Industry | Respondents | Not at All | Minimal | Moderate | Extensive | Fully Integrated | At Least Moderate Today | At Least Moderate in Two Years |
|---|---|---|---|---|---|---|---|---|
| Technology, media and telecom | 530 | 20% | 52% | 22% | 5% | 1% | 28% | 82% |
| Life sciences and health care | 378 | 30% | 46% | 21% | 3% | 1% | 25% | 72% |
| Consumer | 963 | 28% | 49% | 21% | 2% | 1% | 24% | 73% |
| Financial services | 573 | 29% | 50% | 17% | 3% | 1% | 21% | 71% |
| Energy, resources and industrials | 591 | 24% | 57% | 19% | 1% | 0% | 20% | 71% |
| All respondents | 3,235 | 25% | 52% | 20% | 2% | 1% | 23% | 74% |
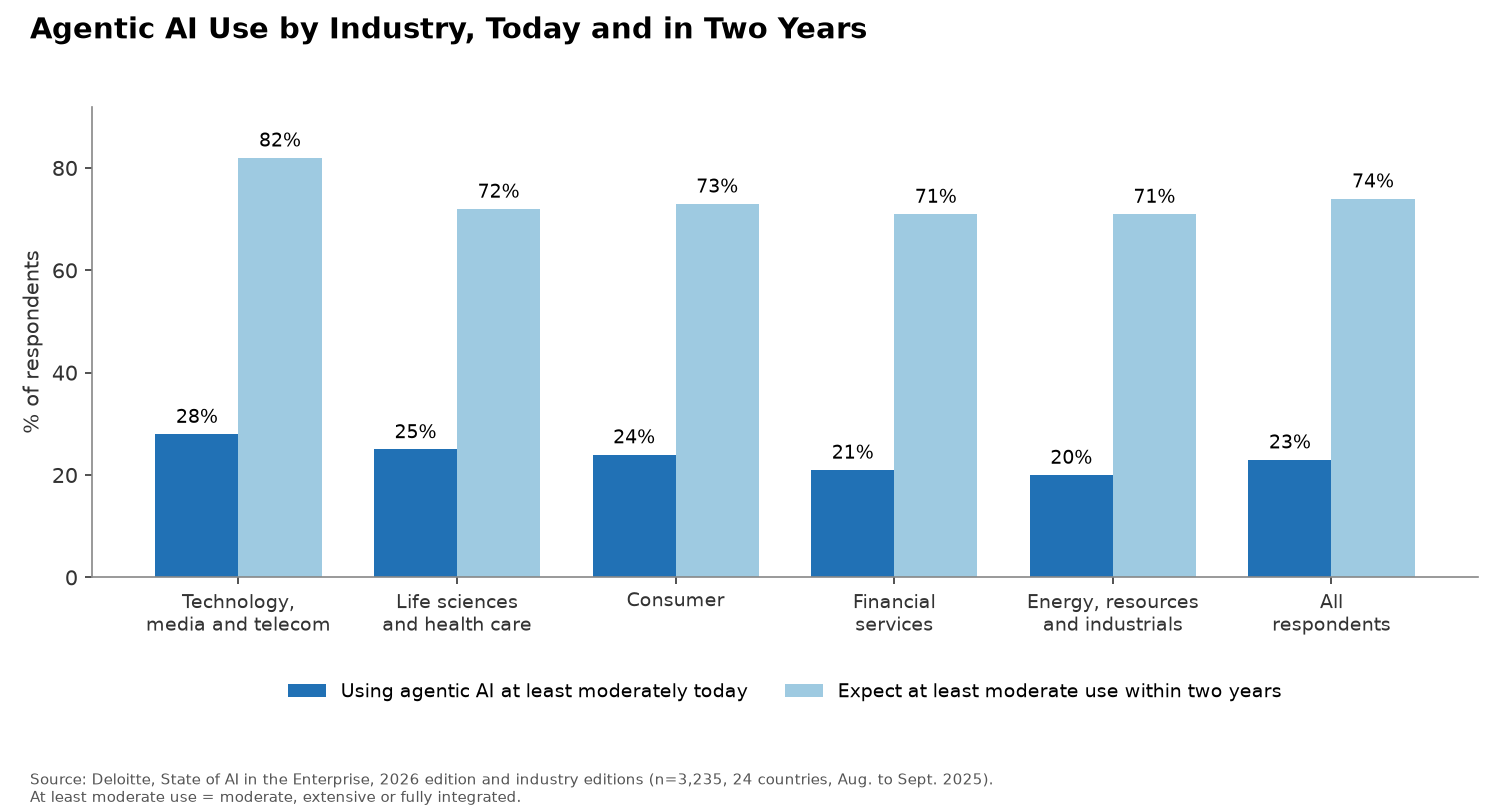
- Technology, media and telecom has the highest share using agentic AI at least moderately, 28%, against 23% across all respondents. Energy, resources and industrials has the lowest, 20%.
- Minimal use is the most common answer in every industry, from 46% in life sciences and health care to 57% in energy, resources and industrials.
- Life sciences and health care has the largest share not using agentic AI at all, 30%, while its share using it at least moderately, 25%, ranks second.
- Within two years, 82% of technology, media and telecom respondents expect at least moderate use, and 11% expect agentic AI to be fully integrated into core operations. The other four industries expect 71% to 73% at least moderate use.
- In Deloitte's previous survey, 42% of technology, media and telecom respondents said their organizations were already exploring autonomous agent development to a large or very large extent, compared with 19% in energy, resources and industrials. That survey asked a different question.
AI Agent Scaling by Industry and Business Function
AI agent scaling by industry, McKinsey, May to June 2026 (% of all respondents in the industry)
| Industry | Respondents | Function With the Highest Share | Highest Share | Functions Where 10% or More Are Scaling Agents (of 9 Reported) |
|---|---|---|---|---|
| Technology | 208 | Software engineering | 31% | 6 |
| Media and telecom | 79 | Knowledge management; service operations | 21% | 7 |
| Financial institutions | 158 | IT; knowledge management | 17% | 6 |
| Travel and logistics | 61 | IT | 17% | 1 |
| Advanced manufacturing | 105 | IT | 15% | 6 |
| Consumer goods and retail | 128 | Marketing and sales | 15% | 3 |
| Insurance | 44 | Service operations | 14% | 1 |
| Professional services | 230 | Knowledge management | 14% | 1 |
| Pharma and medical products | 64 | IT | 12% | 1 |
| Healthcare payers and providers | 52 | IT; software engineering | 11% | 2 |
| Engineering and construction | 88 | Software engineering | 8% | 0 |
| Energy and materials | 177 | IT; software engineering; marketing and sales; manufacturing | 7% | 0 |
| All respondents | 1,719 | IT | 12% | 3 |
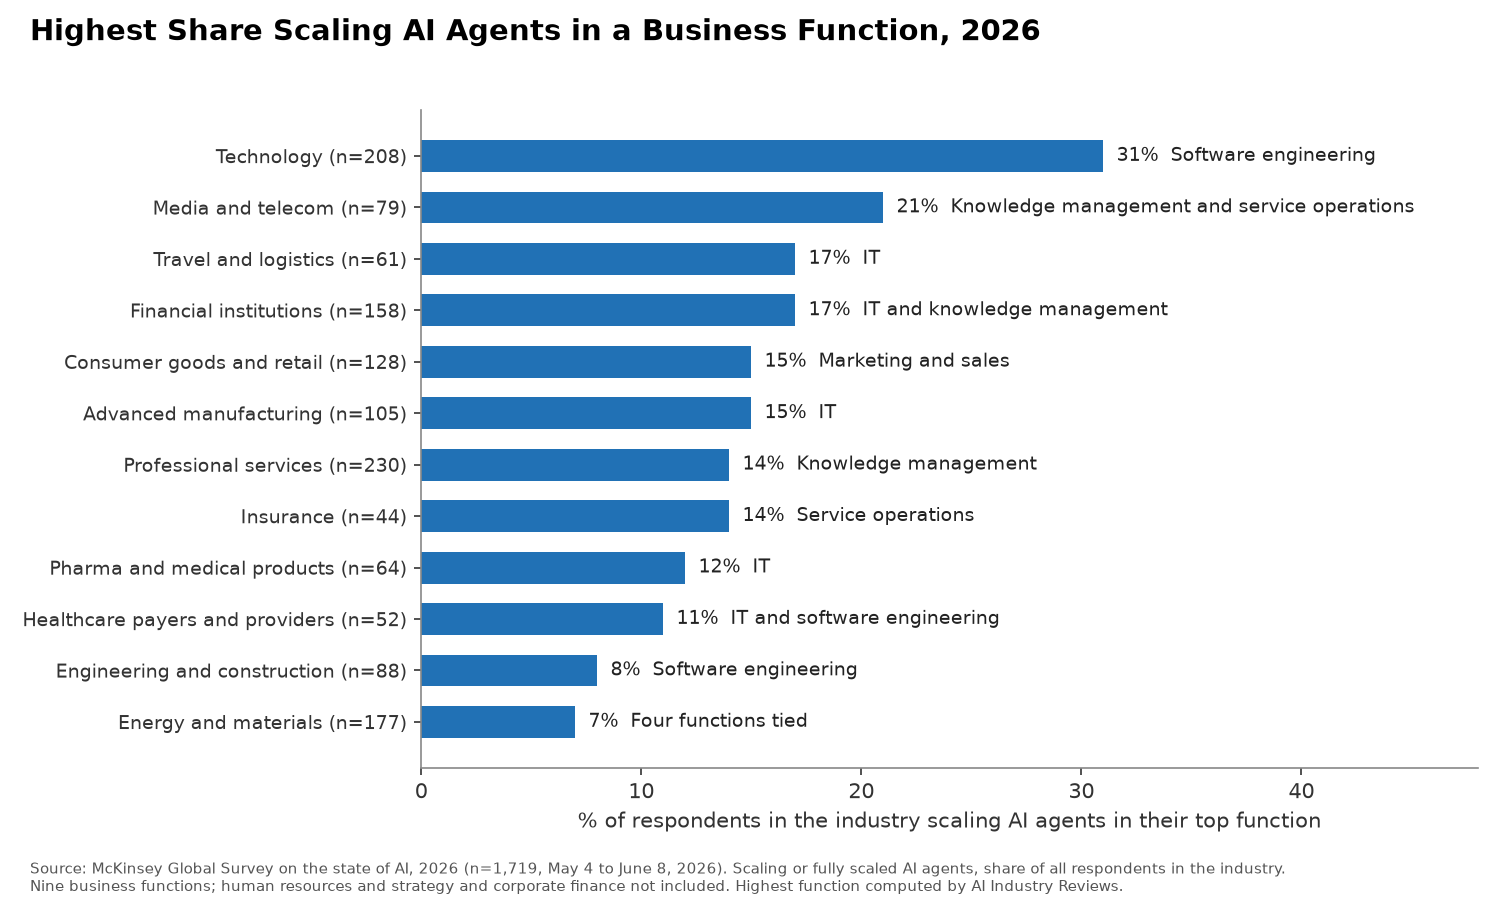
- Technology has the highest share in any single function: 31% of technology respondents say their organizations are scaling AI agents in software engineering.
- Media and telecom has the most functions where at least 10% of respondents are scaling agents, 7 of 9. Technology, financial institutions and advanced manufacturing have 6 each.
- Energy and materials and engineering and construction have no function at 10% or more. Their highest shares are 7% and 8%.
- In healthcare payers and providers, IT and software engineering tie for the highest share at 11%, from a sample of 52.
- Across all respondents, IT has the highest share at 12%, followed by knowledge management at 11% and software engineering at 10%.
Change in AI Agent Scaling From 2025 to 2026
AI agent scaling by industry, McKinsey, 2025 and 2026 (% of all respondents in the industry)
| Industry | Functions at 10% or More, 2025 (of 9 Reported) | Functions at 10% or More, 2026 (of 9 Reported) | Highest Share, 2025 | Highest Share, 2026 |
|---|---|---|---|---|
| Technology | 6 | 6 | 24% | 31% |
| Media and telecom | 3 | 7 | 16% | 21% |
| Financial institutions | 0 | 6 | 7% | 17% |
| Advanced manufacturing | 0 | 6 | 9% | 15% |
| Consumer goods and retail | 0 | 3 | 7% | 15% |
| Insurance | 4 | 1 | 20% | 14% |
| Professional services | 0 | 1 | 6% | 14% |
| Pharma and medical products | 1 | 1 | 11% | 12% |
| Energy and materials | 1 | 0 | 10% | 7% |
| All respondents | 0 | 3 | 9% | 12% |
AI agent scaling by business function, all respondents, McKinsey, 2025 and 2026
| Business Function | 2025 | 2026 | Change (Points) |
|---|---|---|---|
| IT | 9% | 12% | +3 |
| Knowledge management | 8% | 11% | +3 |
| Software engineering | 7% | 10% | +3 |
| Service operations | 7% | 9% | +2 |
| Product and/or service development | 7% | 9% | +2 |
| Marketing and sales | 7% | 8% | +1 |
| Risk, legal, and compliance | 5% | 5% | 0 |
| Supply chain and inventory management | 2% | 5% | +3 |
| Manufacturing | 2% | 3% | +1 |
- Financial institutions and advanced manufacturing each went from no function at 10% or more in 2025 to 6 in 2026. McKinsey's 2025 group was named banking and other financial institutions.
- Technology's share scaling agents in software engineering rose from 24% to 31%, the largest share in either year.
- Insurance's highest share fell from 20% in marketing and sales to 14% in service operations, and its sample fell from 80 to 44.
- Across all respondents, every function rose by 1 to 3 points except risk, legal, and compliance, which stayed at 5%.
- At organizations with revenue of $1 billion or more, 40% were scaling agents in at least one function in 2026, up from 27% in 2025. At smaller organizations the share was 22% in both years.
- McKinsey changed its healthcare, travel and engineering groups between the two surveys, so those industries are left out of the comparison.
AI Agent Deployment in US Banking, Technology and Asset Management
AI agent adoption in three US industries, KPMG, November to December 2025
| Industry | Deploying AI Agents | Piloting AI Agents |
|---|---|---|
| Banking | 40% | Not published |
| Technology, media and telecommunications | 36% | 60% |
| Asset management and private equity | 24% | 68% |
| All industries (Q4 2025 survey) | 26% | Not published |
- Banking's 40% is 14 points above the 26% KPMG reported across industries in the same quarter.
- KPMG's cross-industry deployment share was 11% in Q1 2025 and 42% in Q3 2025 before falling to 26% in Q4 2025. KPMG says leaders have adopted "more sophisticated definitions of what constitutes a true agent."
- KPMG's global survey three months later, which groups banks with other financial firms across 20 countries, places financial services last of eight sectors, at 50% deploying or beyond.
General AI Use by Industry, Census Bureau Data
The Census Bureau's Business Trends and Outlook Survey asks US businesses whether they used AI in any business function in the past two weeks. Virtual agents appear only as one example in its definition of AI, so these figures measure general AI use, and the survey covers businesses of every size.
General AI use by sector, US businesses, two weeks of September 7 to 20, 2026 (selected sectors)
| Sector (NAICS) | Used AI in Past Two Weeks | Standard Error (Points) |
|---|---|---|
| Information (51) | 50.2% | 1.43 |
| Professional, scientific, and technical services (54) | 42.7% | 1.01 |
| Finance and insurance (52) | 40.1% | 1.86 |
| Educational services (61) | 39.9% | 2.88 |
| Health care and social assistance (62) | 24.8% | 1.01 |
| Manufacturing (31) | 20.8% | 1.22 |
| Construction (23) | 17.2% | 0.72 |
| Retail trade (44) | 16.8% | 0.83 |
| Transportation and warehousing (48) | 10.5% | 0.67 |
| Accommodation and food services (72) | 10.1% | 0.71 |
| All sectors | 23.8% |
- Information, the sector that includes software publishing, telecommunications and data processing, has the highest share at 50.2%. It is the closest Census match to the technology, media and telecom groups that rank first in KPMG's global sector survey and in Deloitte's survey.
- Finance and insurance is at 40.1%, health care and social assistance at 24.8% and manufacturing at 20.8%, against 23.8% for all US businesses.
Limits of Agentic AI Adoption Data by Industry
All five surveys rely on what executives say about their own organizations. KPMG does not publish how many respondents it had in each sector, and its deploying-or-beyond totals are sums of rounded shares, so they can be off by a point. McKinsey reports agent scaling one function at a time with no single rate per industry, and several of its 2026 industry groups are small, including insurance (44) and healthcare payers and providers (52). KPMG's US industries survey covers three industries at companies with revenue of $1 billion or more, and its banking results do not include a piloting share. Deloitte's life sciences and health care chart prints N=573, while the same report gives that industry's sample as 378. Deloitte surveyed only organizations that already use AI daily, so its rates describe AI users.
Sources
- AI Industry Reviews, Agentic AI Adoption Study: analysis of five AI agent adoption surveys with industry breakdowns from McKinsey, KPMG and Deloitte, fielded June 2025 to June 2026, with Census Bureau data on general AI use by sector, conducted October 2026.
- McKinsey & Company, The state of AI in 2026: On the road to ROI, August 2026. https://www.mckinsey.com/capabilities/quantumblack/our-insights/the-state-of-ai
- McKinsey & Company, The state of AI in 2025: Agents, innovation, and transformation, November 2025. https://www.mckinsey.com/capabilities/quantumblack/our-insights/the-state-of-ai
- KPMG International, Global AI Pulse Q1 2026: Sector insights. https://assets.kpmg.com/content/dam/kpmgsites/xx/pdf/2026/05/global-ai-pulse-sector-insights.pdf
- KPMG International, Global AI Pulse Q1 2026: From adoption to orchestration. https://assets.kpmg.com/content/dam/kpmgsites/xx/pdf/2026/04/global-ai-pulse.pdf
- KPMG International, Global AI Pulse survey press release, March 31, 2026. https://kpmg.com/xx/en/media/press-releases/2026/03/kpmg-global-ai-pulse-survey.html
- KPMG LLP, Quarterly AI Pulse Survey: Industries, February 24, 2026. https://kpmg.com/us/en/media/news/ai-pulse-industries.html
- KPMG LLP, Q4 2025 AI Pulse Survey, January 15, 2026. https://kpmg.com/us/en/media/news/q4-ai-pulse.html
- Deloitte, State of AI in the Enterprise: The untapped edge, January 2026. https://www.deloitte.com/content/dam/assets-zone3/us/en/docs/services/consulting/2026/state-of-ai-2026.pdf
- Deloitte, State of AI in the Technology, Media, and Telecommunications Industry. https://www.deloitte.com/content/dam/assets-zone3/us/en/docs/services/consulting/2026/StateofAI-TMT.pdf
- Deloitte, State of AI in the Life Sciences and Health Care Industry. https://www.deloitte.com/content/dam/assets-zone3/us/en/docs/services/consulting/2026/StateofAI-LSHC.pdf
- Deloitte, State of AI in the Consumer Industry, March 2026. https://www.deloitte.com/content/dam/assets-shared/docs/about/2026/state-of-ai-consumer.pdf
- Deloitte, State of AI in the Financial Services Industry. https://www.deloitte.com/content/dam/assets-zone3/us/en/docs/services/consulting/2026/StateofAI-Financial-Services.pdf
- Deloitte, State of AI in the Energy, Resources, and Industrials Industry. https://www.deloitte.com/content/dam/assets-zone3/us/en/docs/services/consulting/2026/StateofAI-ERI.pdf
- U.S. Census Bureau, Business Trends and Outlook Survey, sector estimates. https://www.census.gov/hfp/btos/downloads/Sector.xlsx
- U.S. Census Bureau, Business Trends and Outlook Survey, national estimates. https://www.census.gov/hfp/btos/downloads/National.xlsx
- U.S. Census Bureau, Business Trends and Outlook Survey, core and AI questionnaire. https://www.census.gov/hfp/btos/downloads/BTOS%20Core%20and%20AI%20Content.pdf